Anastacia Dwyer

ABOUT THE PROJECT

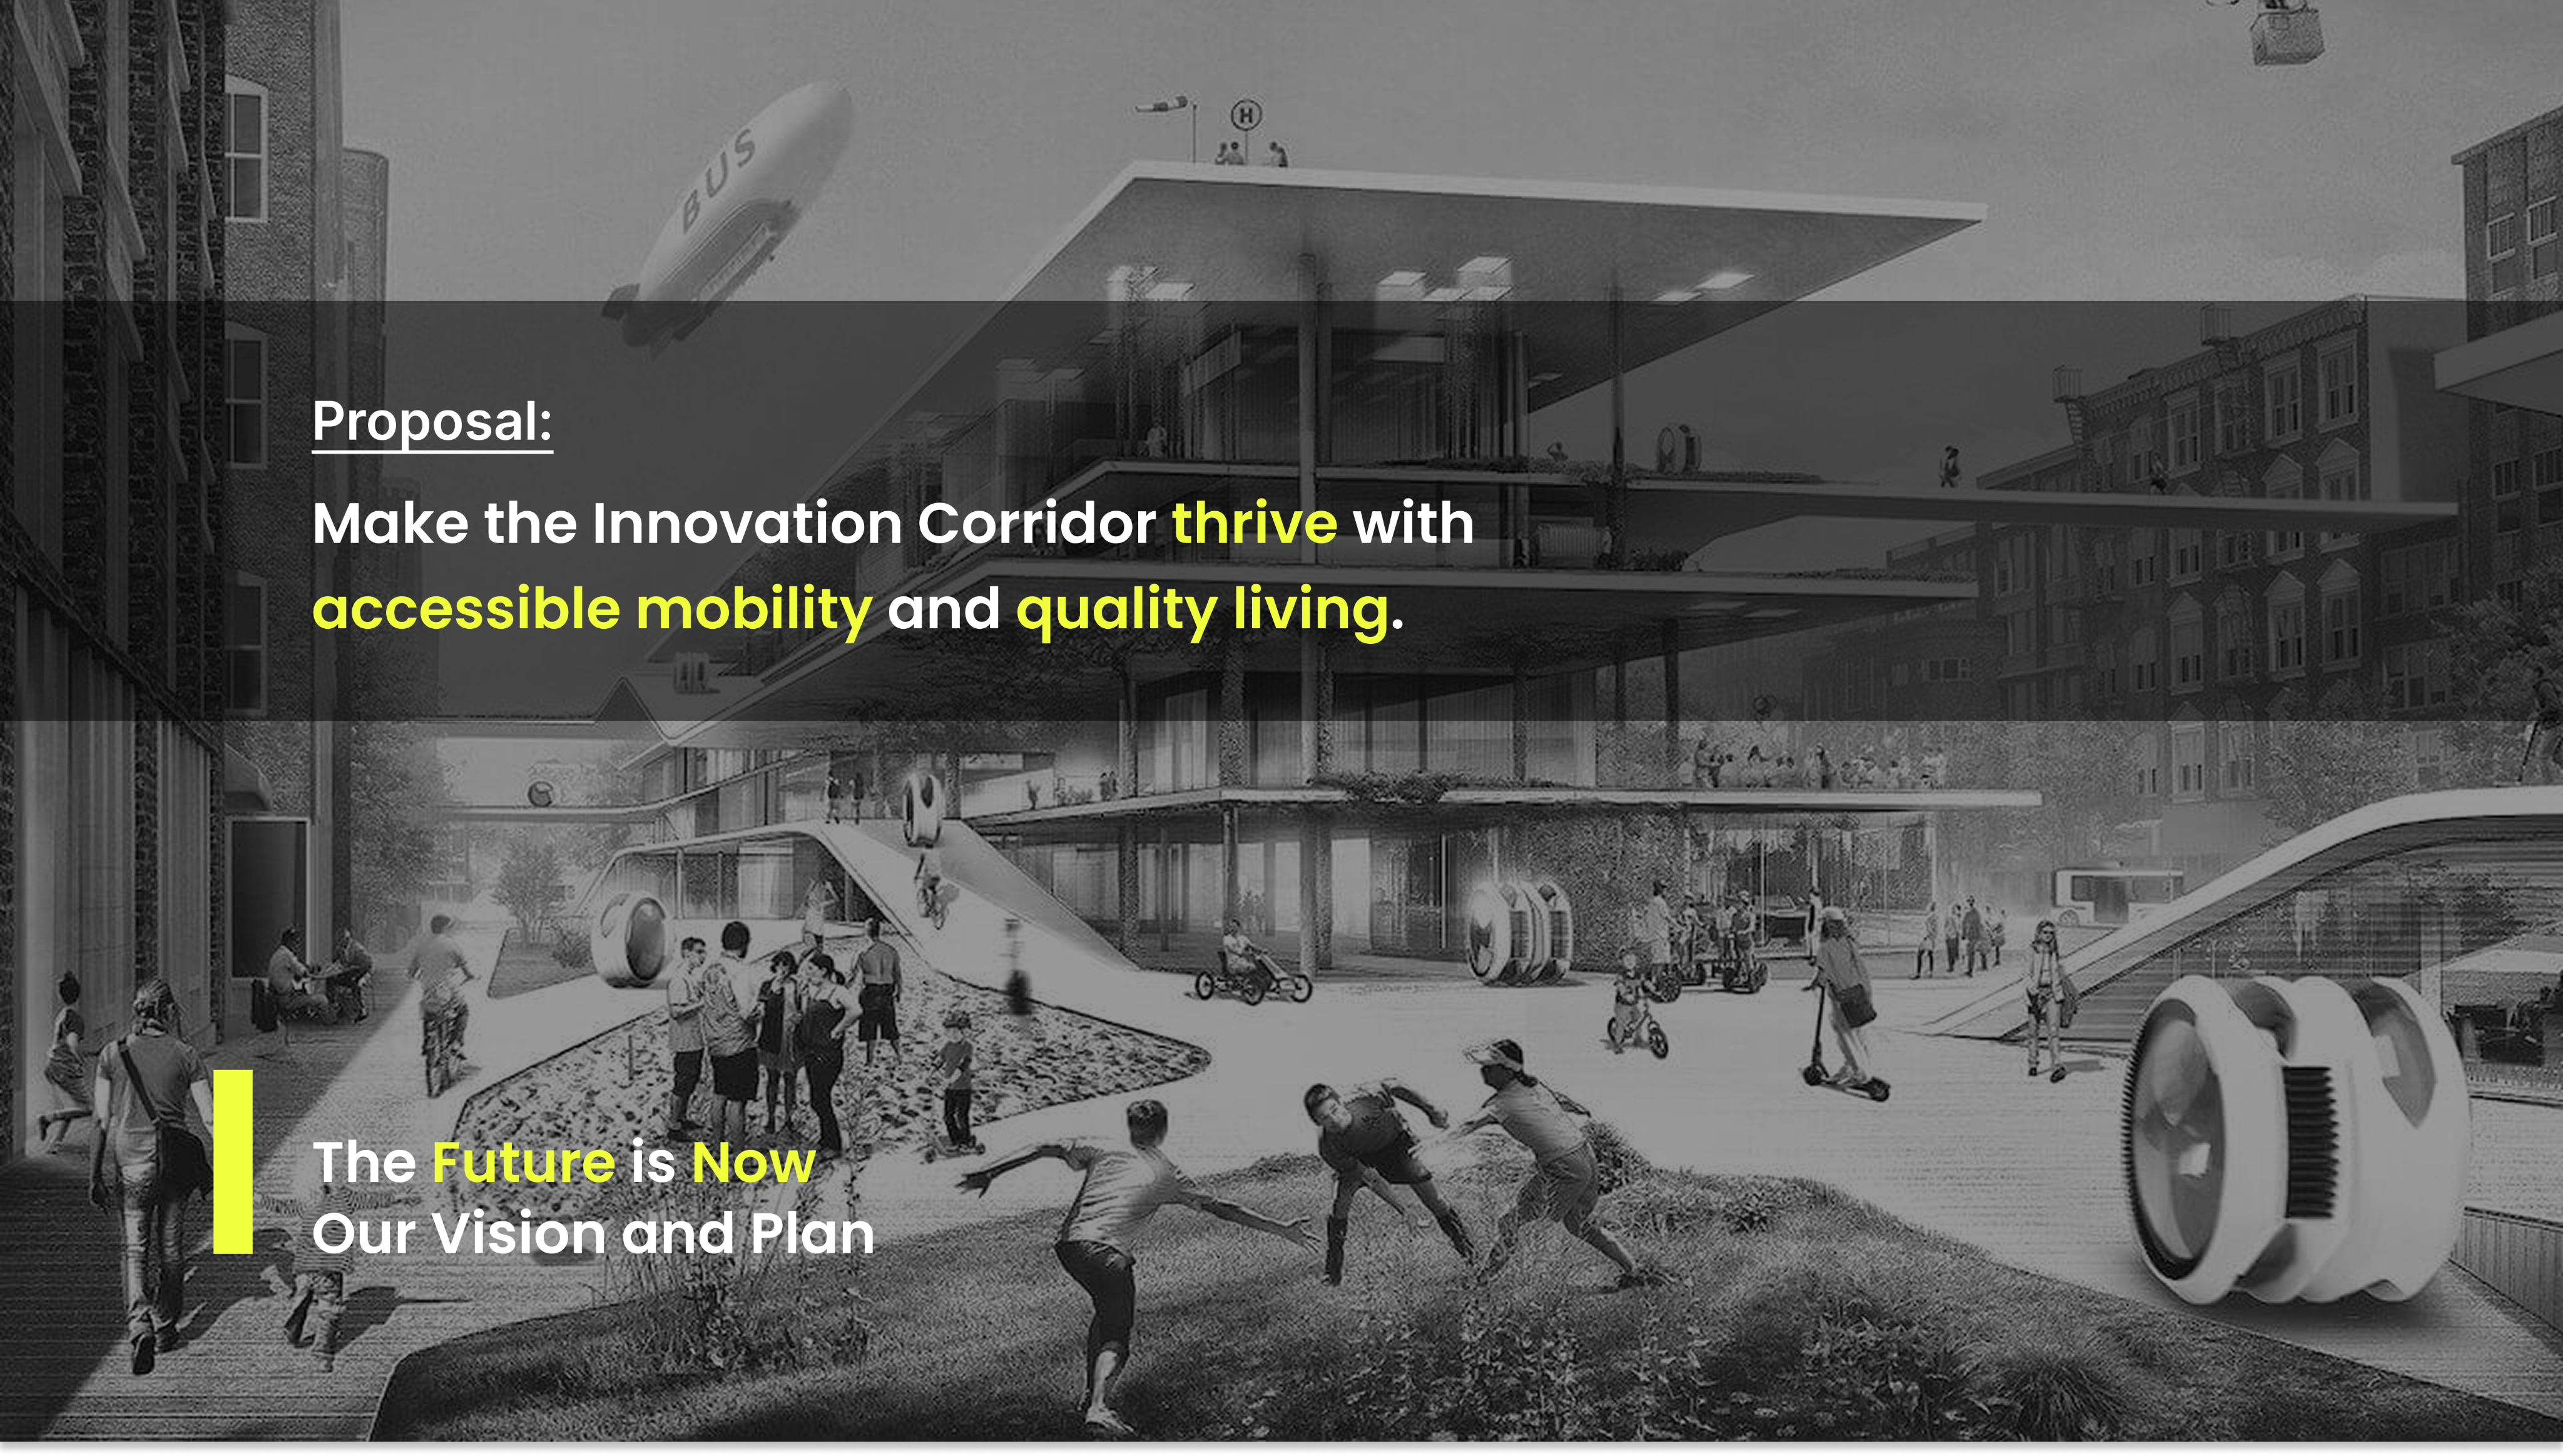
Thrive Cincinnati is a speculative future group project that aims to understand, forecast, and improve the transportation system and experience in the Cincinnati Innovation District in 2030. The project was part of a collaborative studio sponsored by the Cincinnati Innovation District and Gravity Sketch platform.

The project took place over the course of a semester involving 2 phases:

​

  1. Research Phase
  2. Product Design Phase

​

*Introduction

*Research

*Ideation

*Refinement

*Wrap Up

Project Timeline:

1

2

Field Survey: Introduction

Field Survey Around 1819

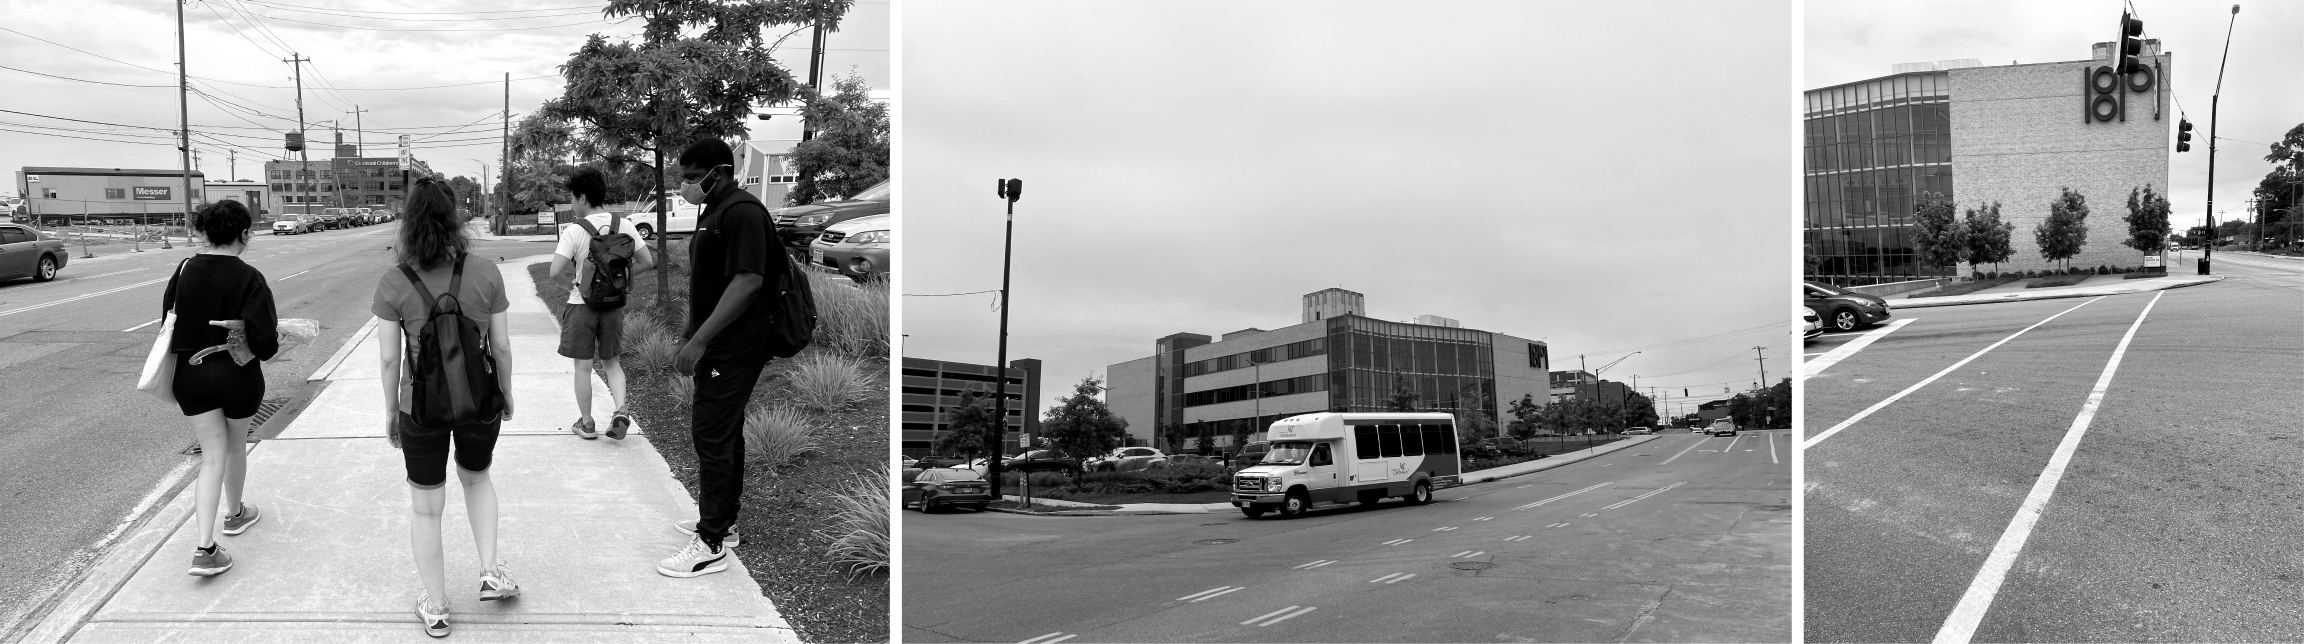
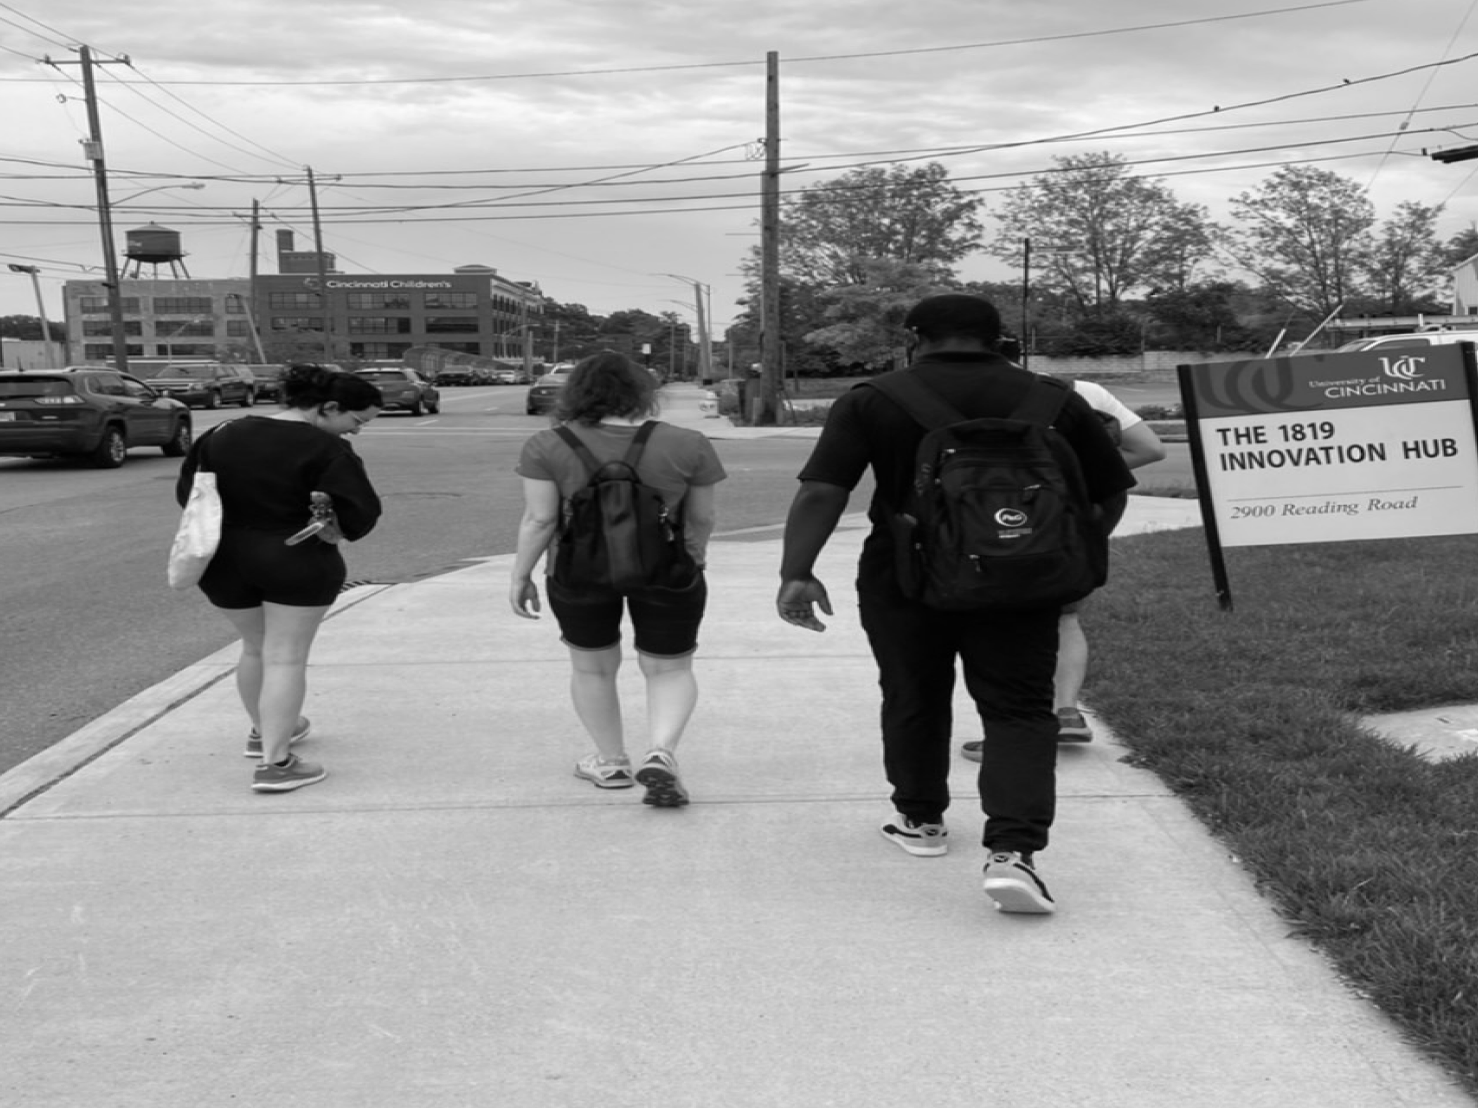
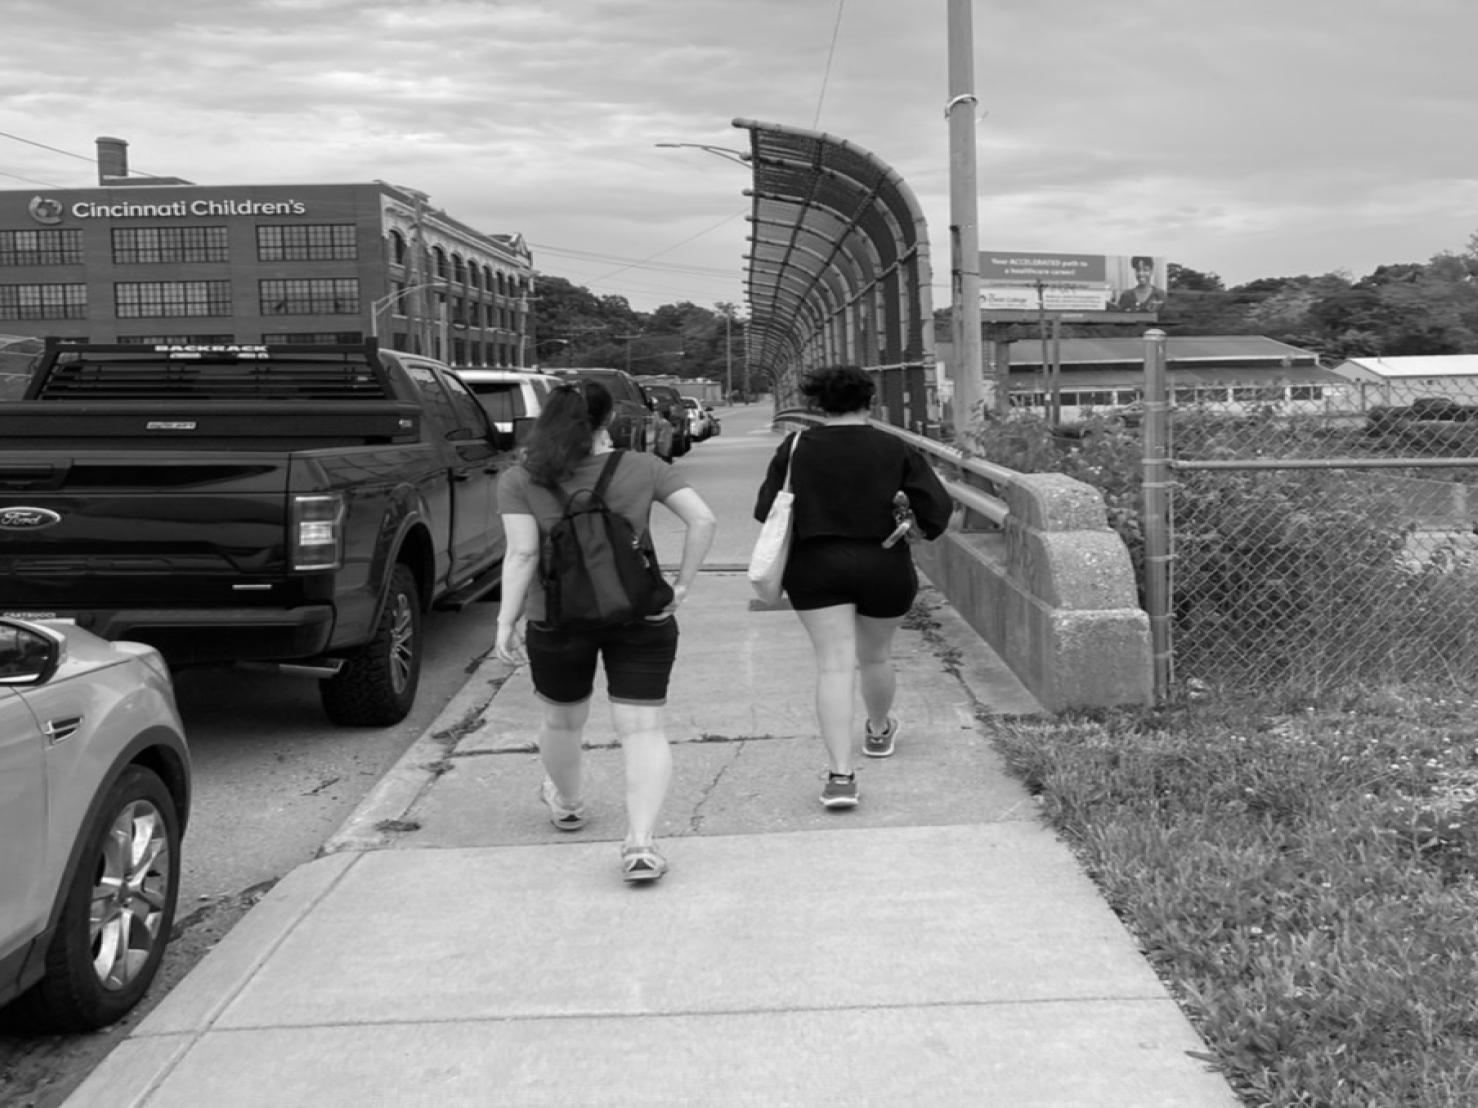
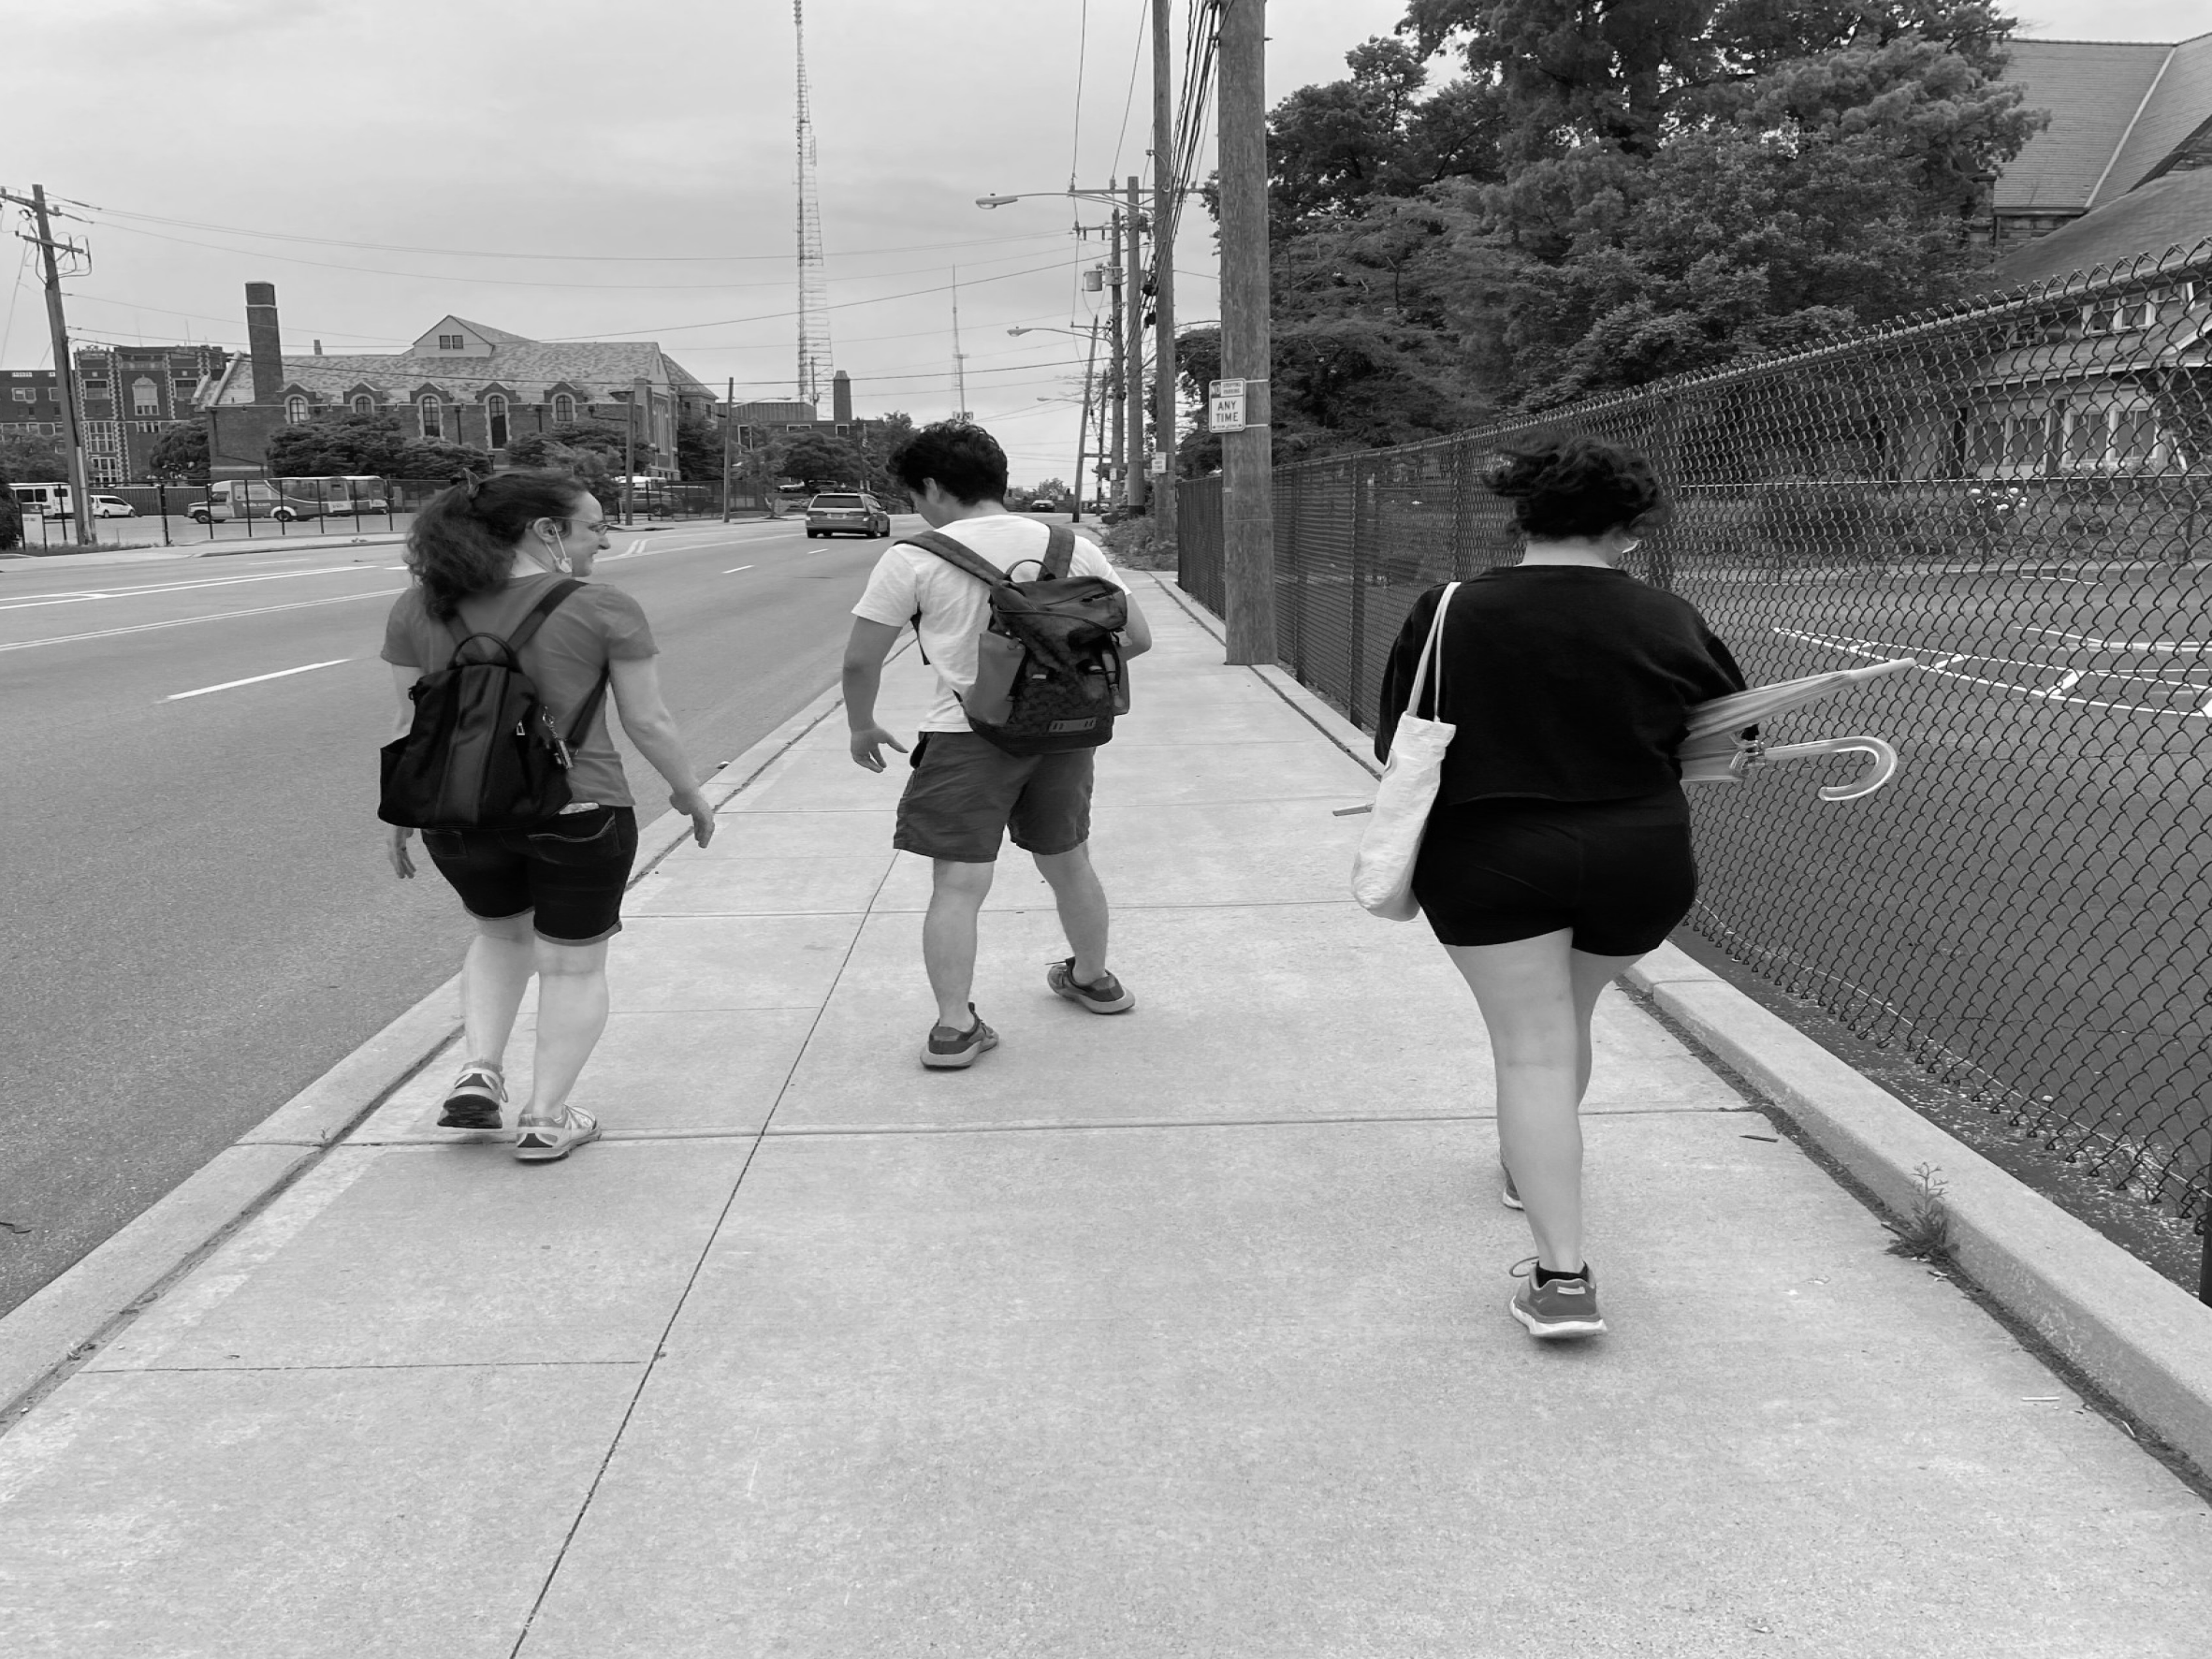
As a group, we made a trip to 1819 Innovation Center and walked around to get an perspective of the surrounding area. A couple of aspects we focused on were traffic volume of various transportation means, driving lanes, parking availability, sidewalk condition, and basic infrastructure.

Observation: Unwelcoming Atmosphere

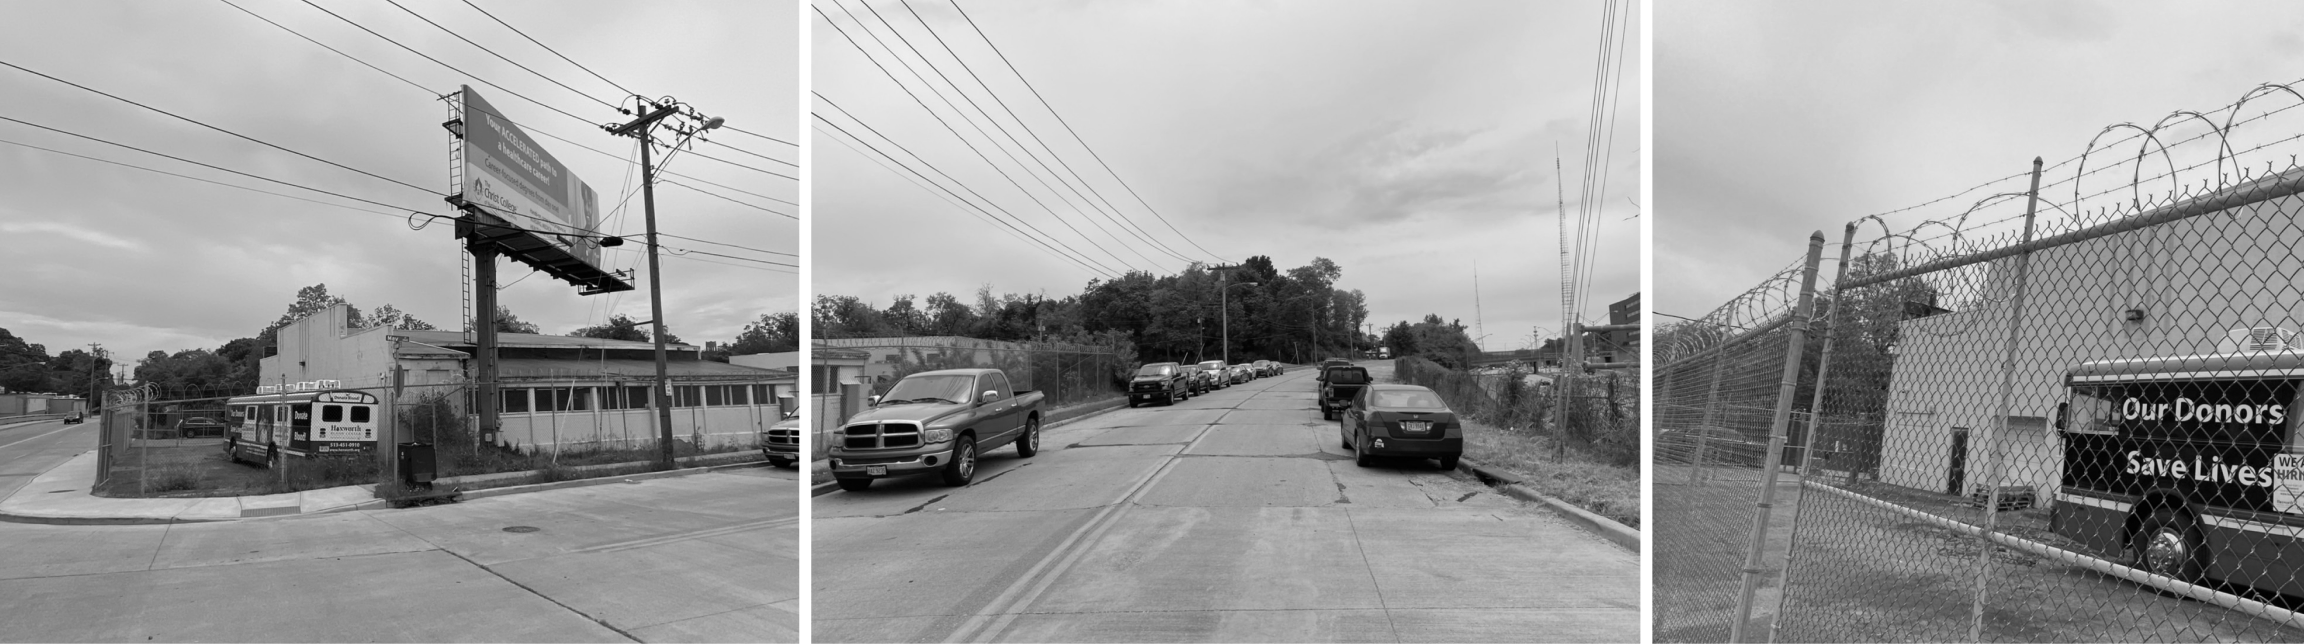
The area surrounding 1819 Innovation Center feels undeveloped and not taken care of properly. The the barbed wire and tall weeds around the the neighborhood may signal an unwelcoming atmosphere to visitors.

Tall weeds

Unmaintained road

Barbed wire

Old building surrounding 1819 felt abandoned

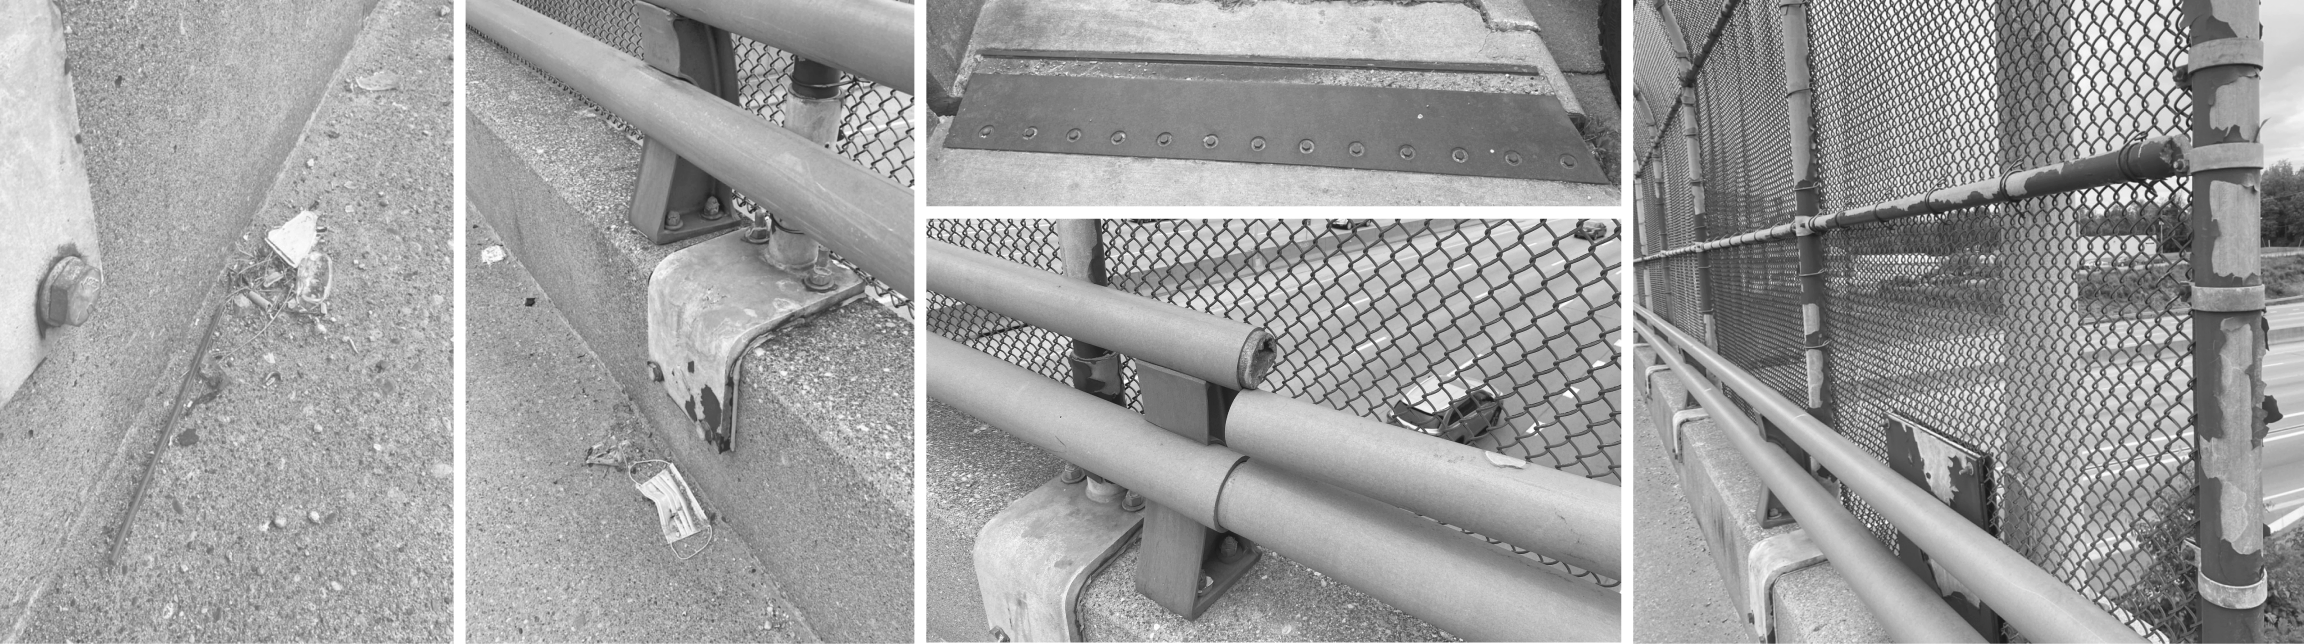
Broken glass

Trash and debris

Broken barriers

Highway overpass

Uneven surface

Observation: Lack of Maintenance

There is a lack of maintenance in the infrastructure around the 1819 Innovation Hub. The wire fences are worn, the trash can was difficult to find, and there was a lot of trash on the sidewalk.

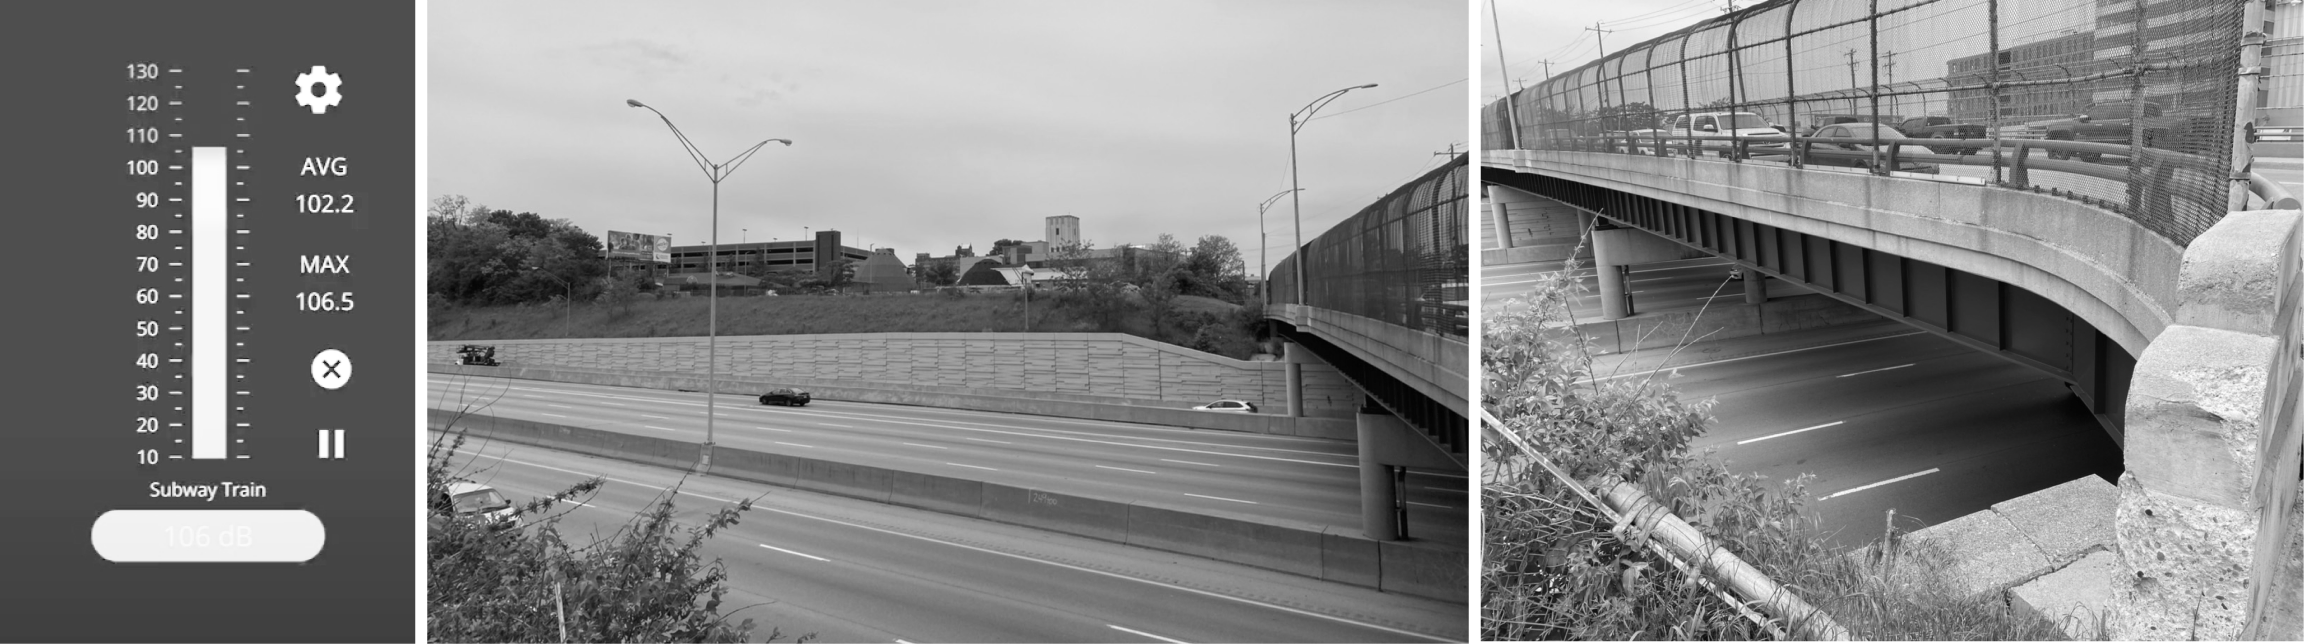
The high speed of highway is causing high noise level and less pleasant experience while walking on the pedestrian bridge. The guard-rail on the side of the bridge is also missing, causing safety concerns.

Observation: Highway Adjacency

Visual of proximity of highway to innovation center

High noise level detected on pedestrian bridge

Broken barriers on bridge

Reading Road Sidewalk

Lincoln Ave Sidewalk

Lincoln Ave Sidewalk(close to I-75)

Linton St Sidewalk

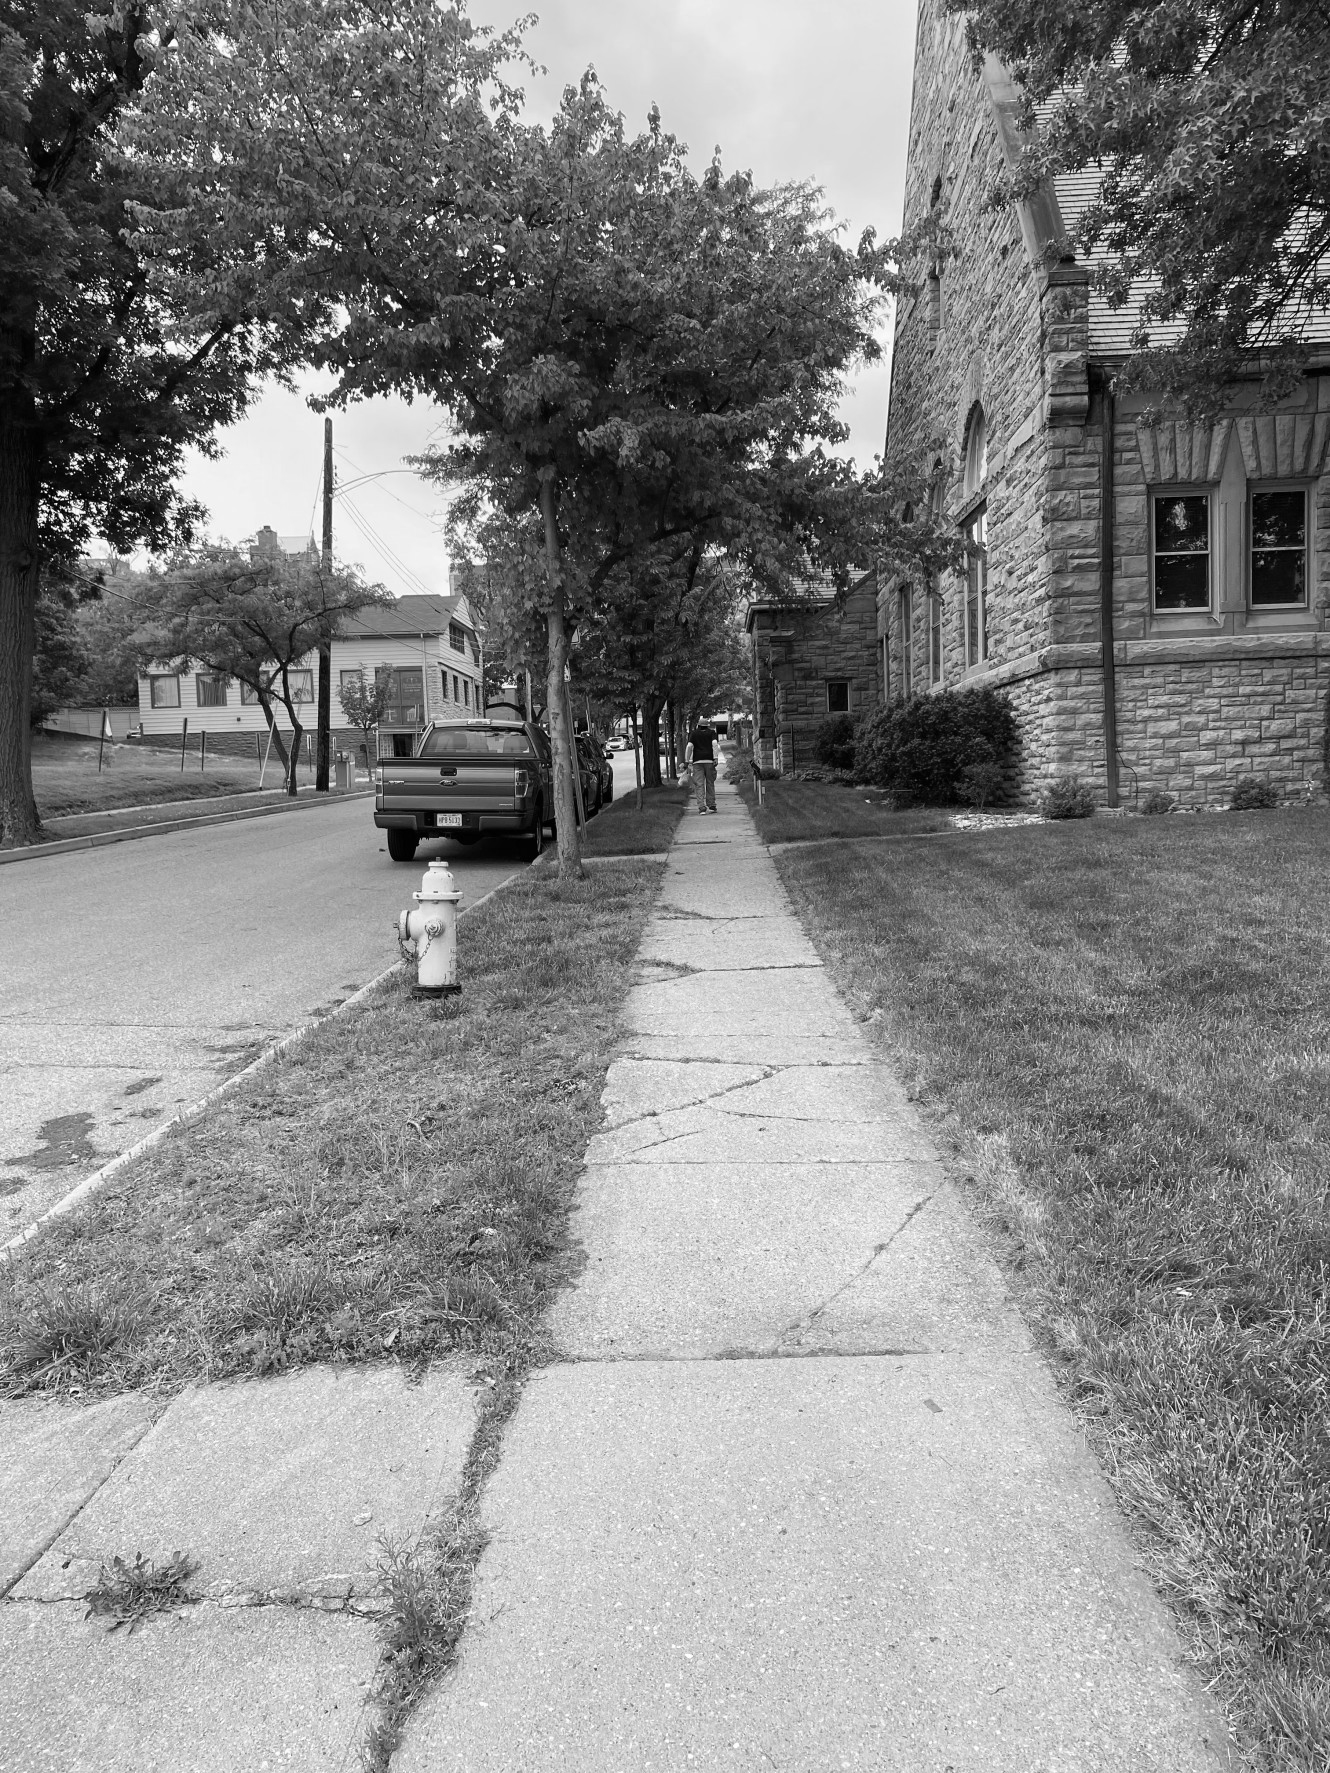
There is a change of width, pavement condition, and level of maintenance on different parts within the area causing inconsistent pedestrian experience.

Observation: Change of Sidewalk

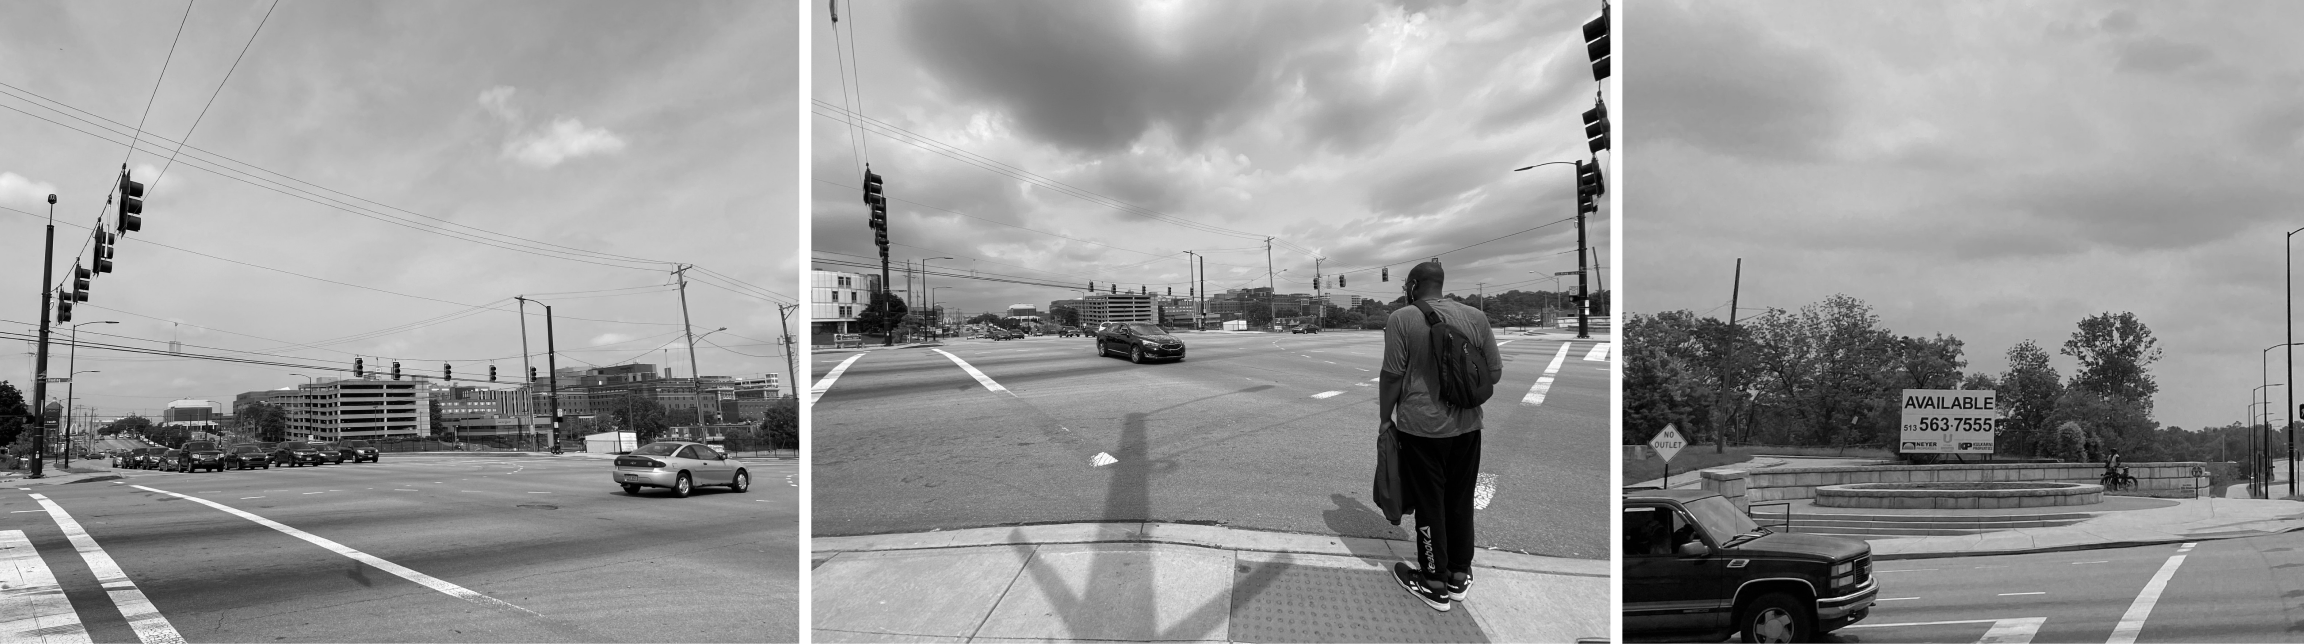
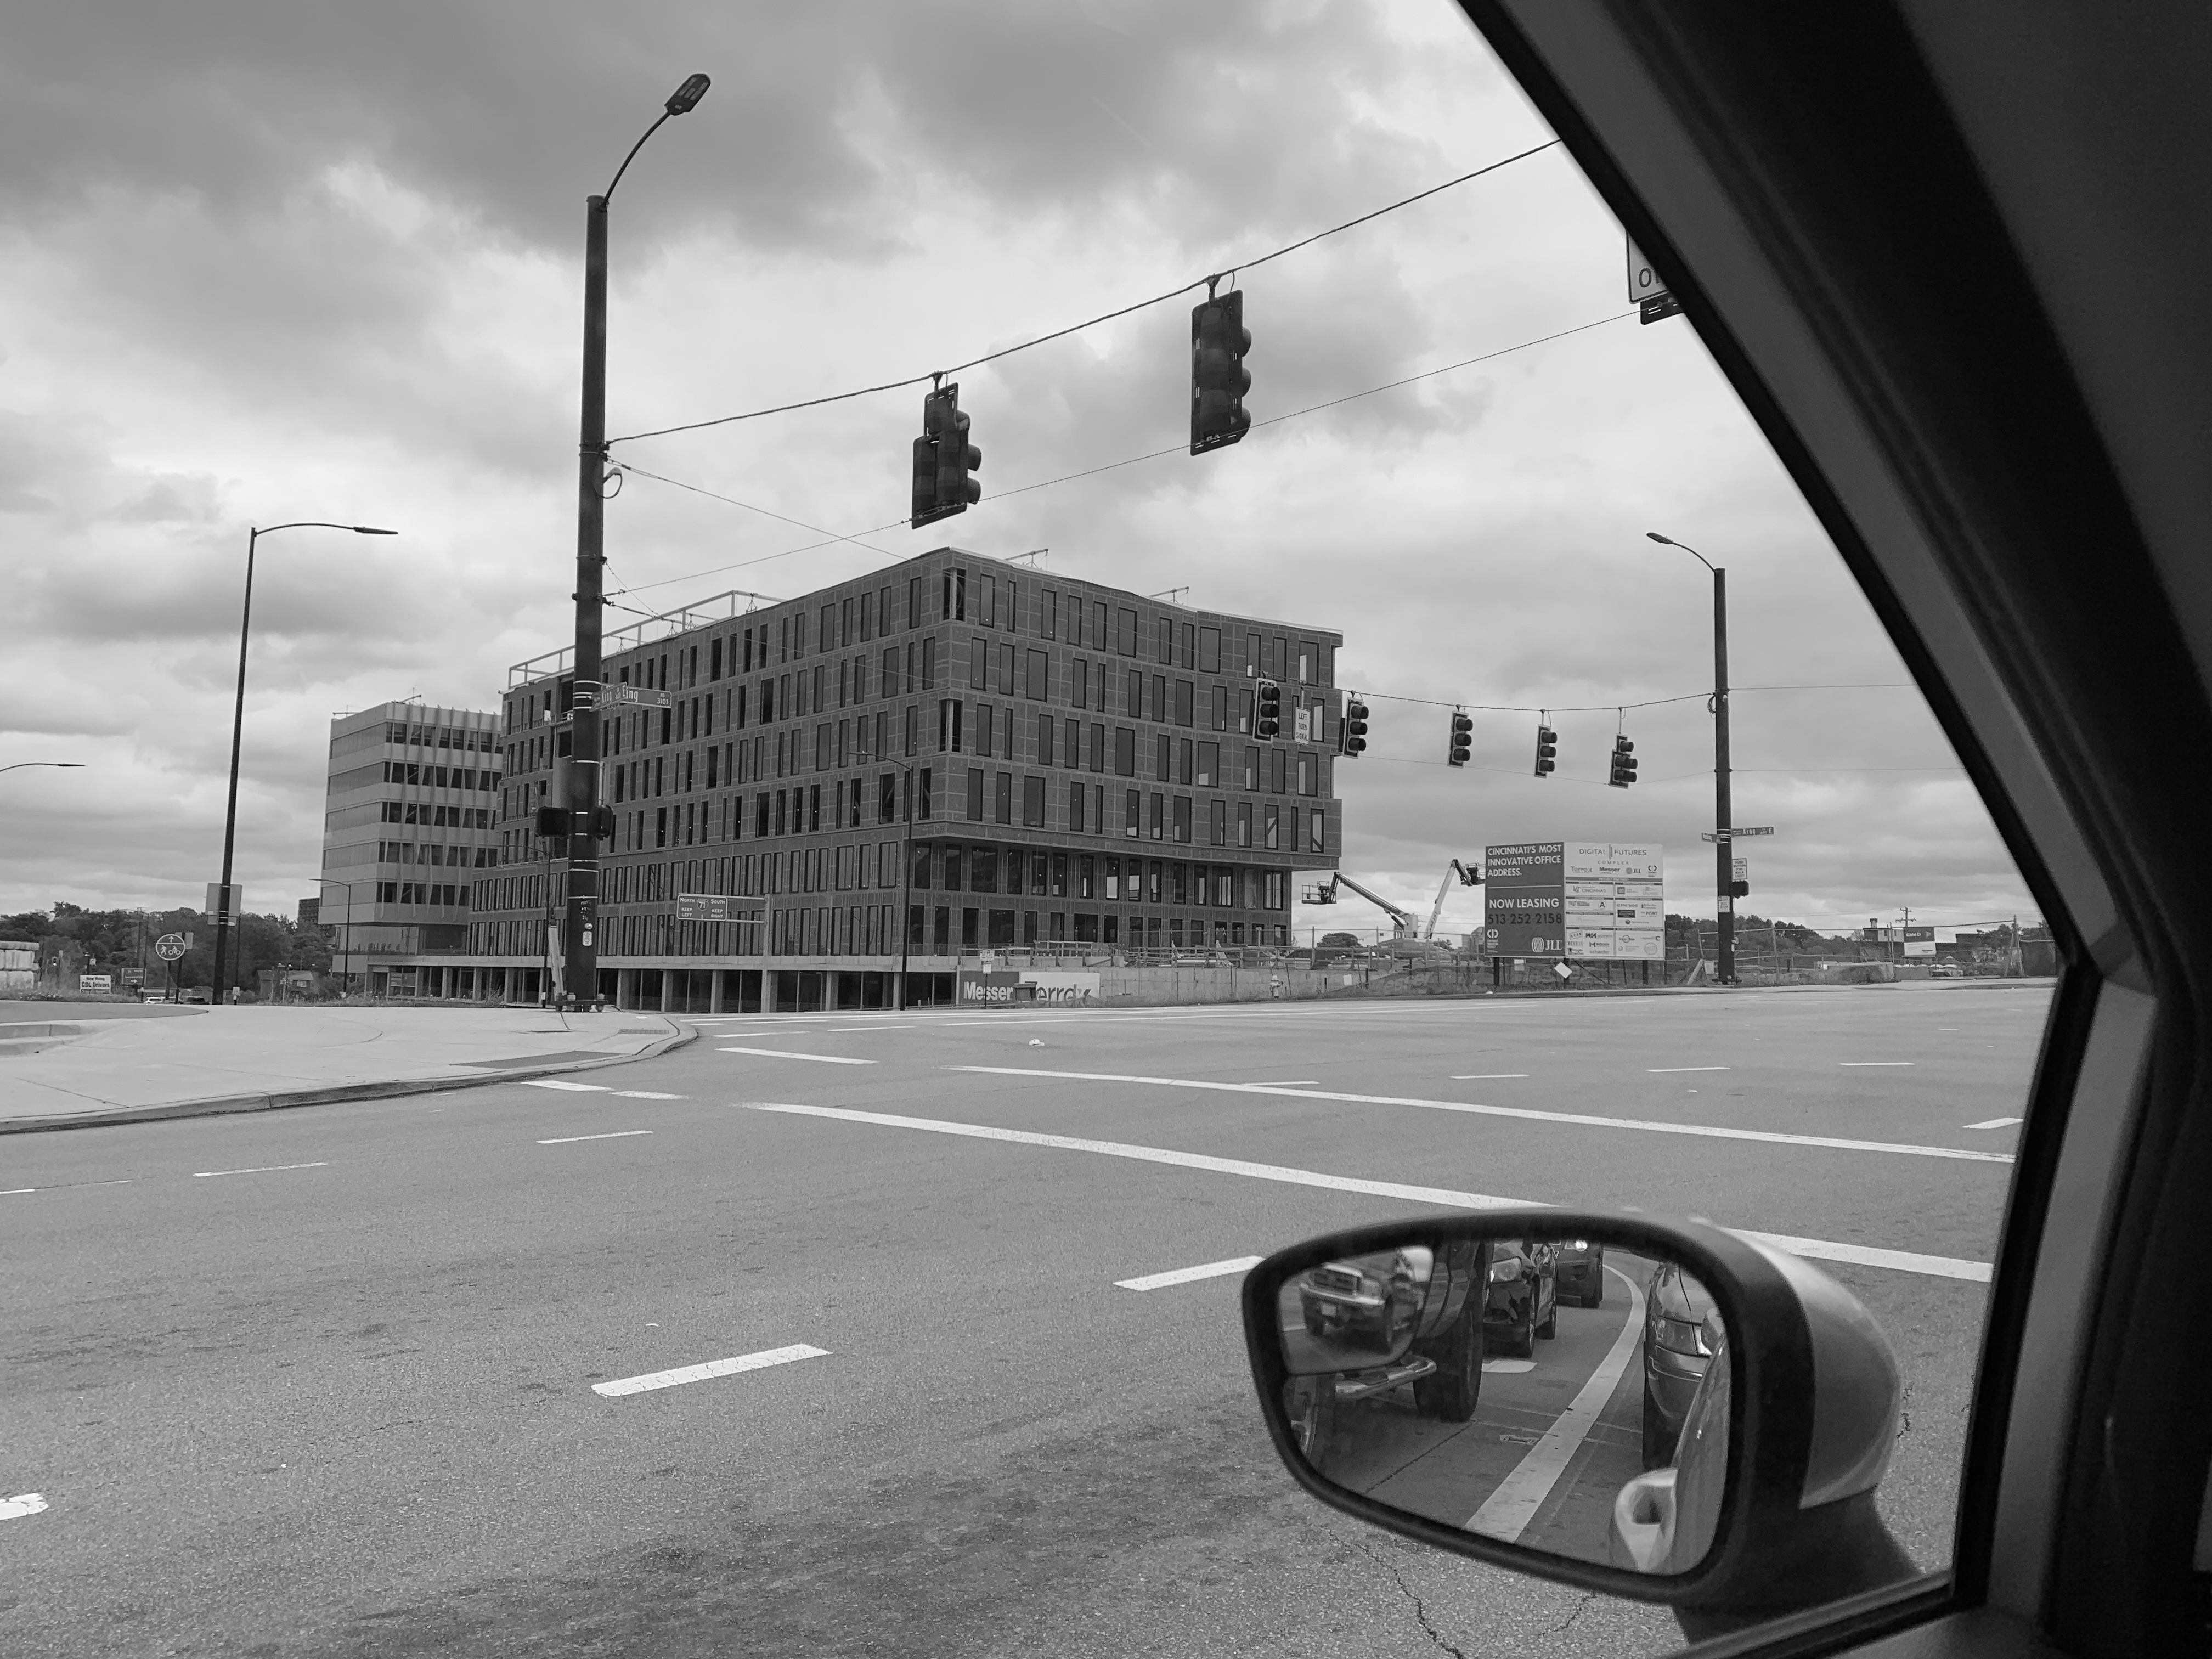
6 Lanes, high traffic volume, fast speed

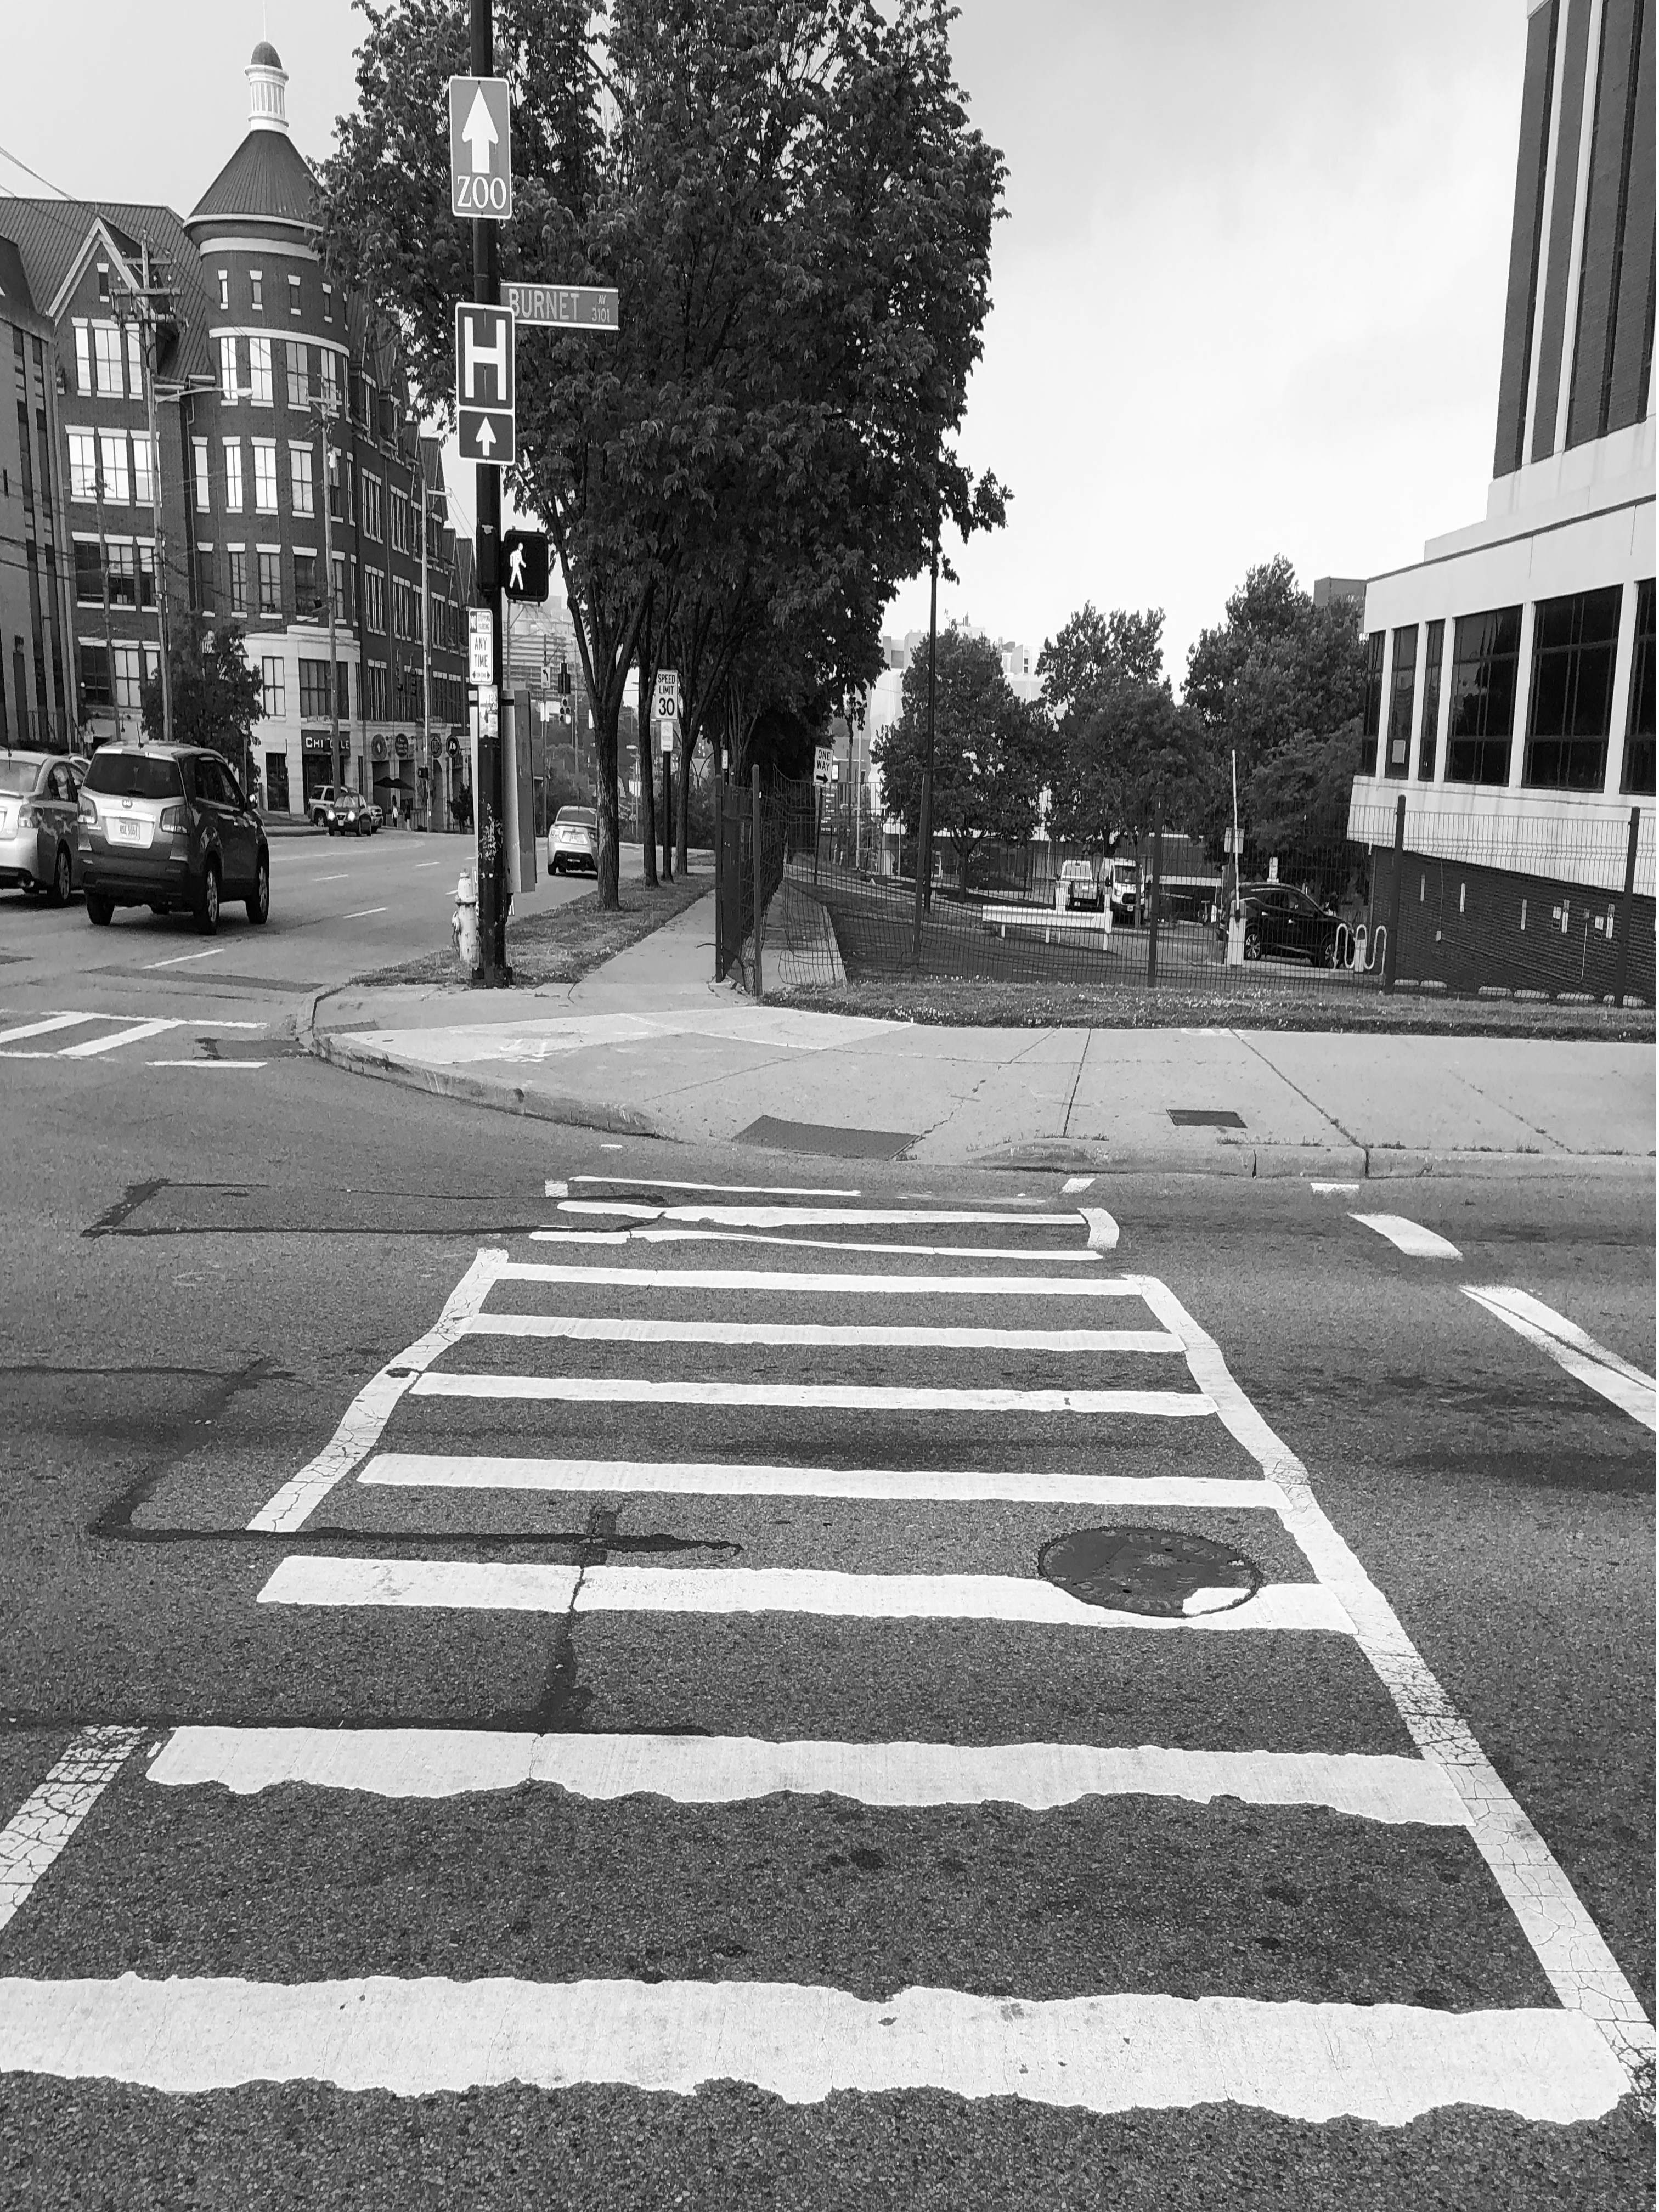
Observation: Dangerous Intersections

The MLK and Reading Rd intersection is planned as the gateway and transformative anchor for the Uptown community. The on-site observation of real-time traffic helps to better understand the current transportation experiences.

Wide crossroad,

Very few pedestrian,

Sufficient time to cross

Unpurposed shared space

Field Survey: Analysis of Current Transit Options

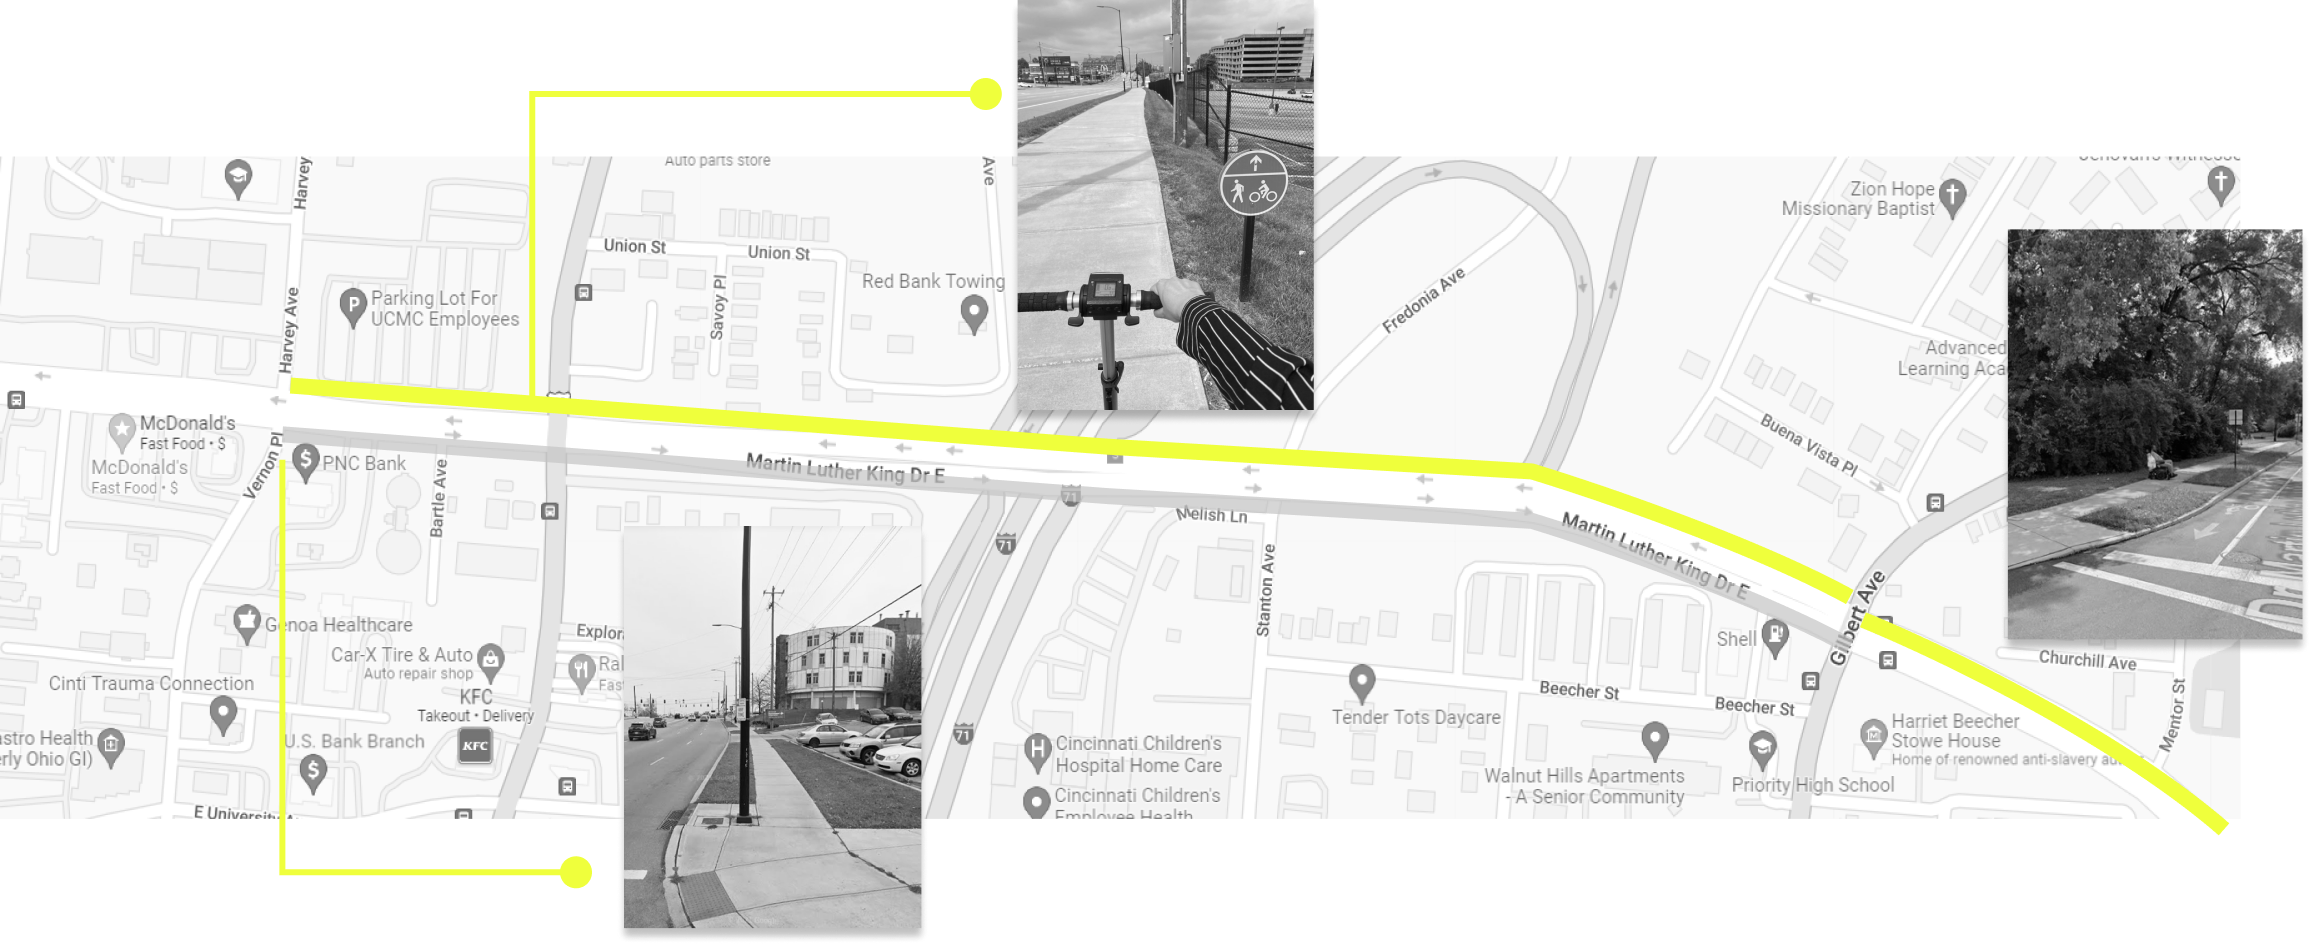
Scooter Route

Riding scooters on MLK in different directions results in a different riding experience. There is a difference in the friendliness for scooter-riding on the left and right side of the MLK Drive.

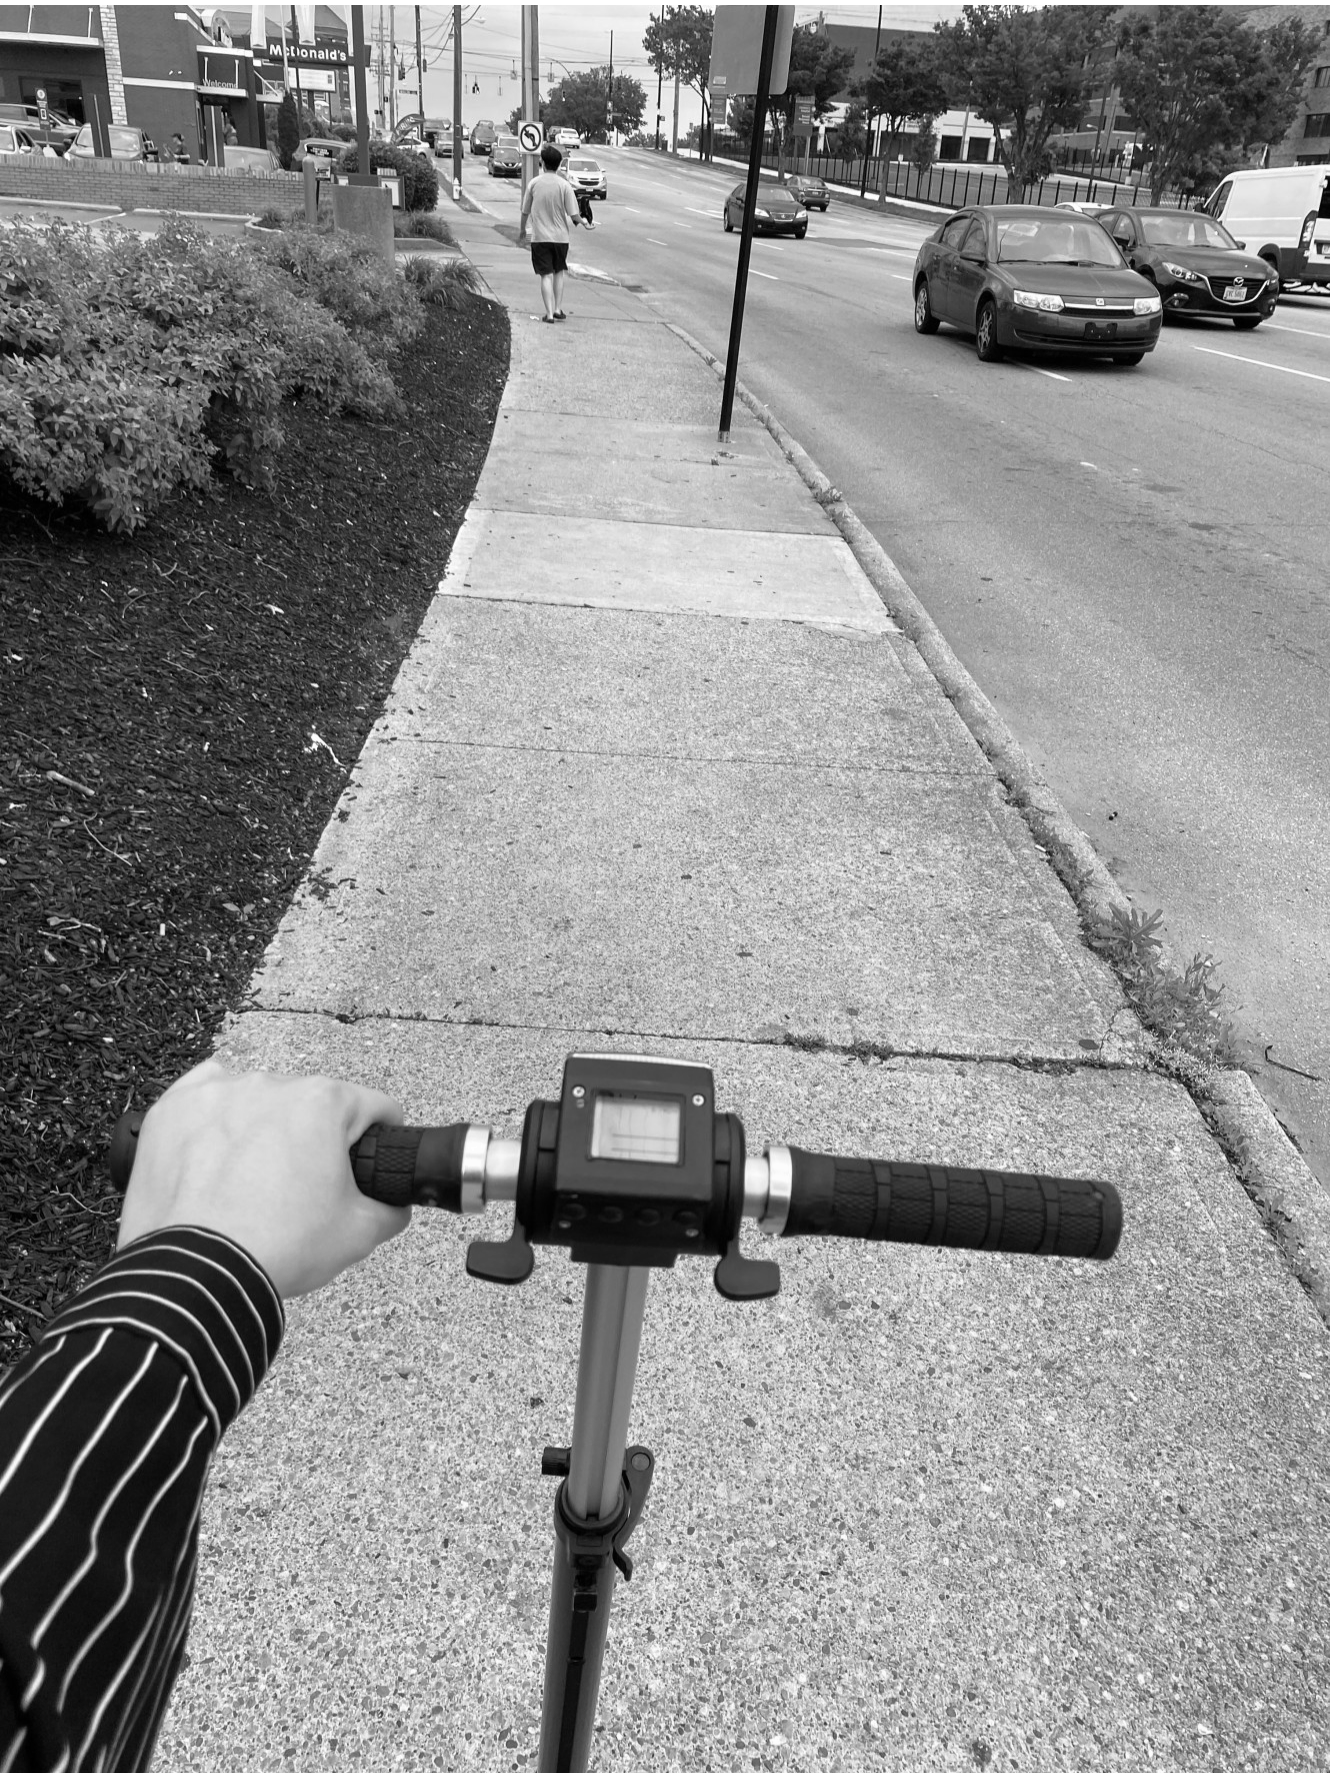
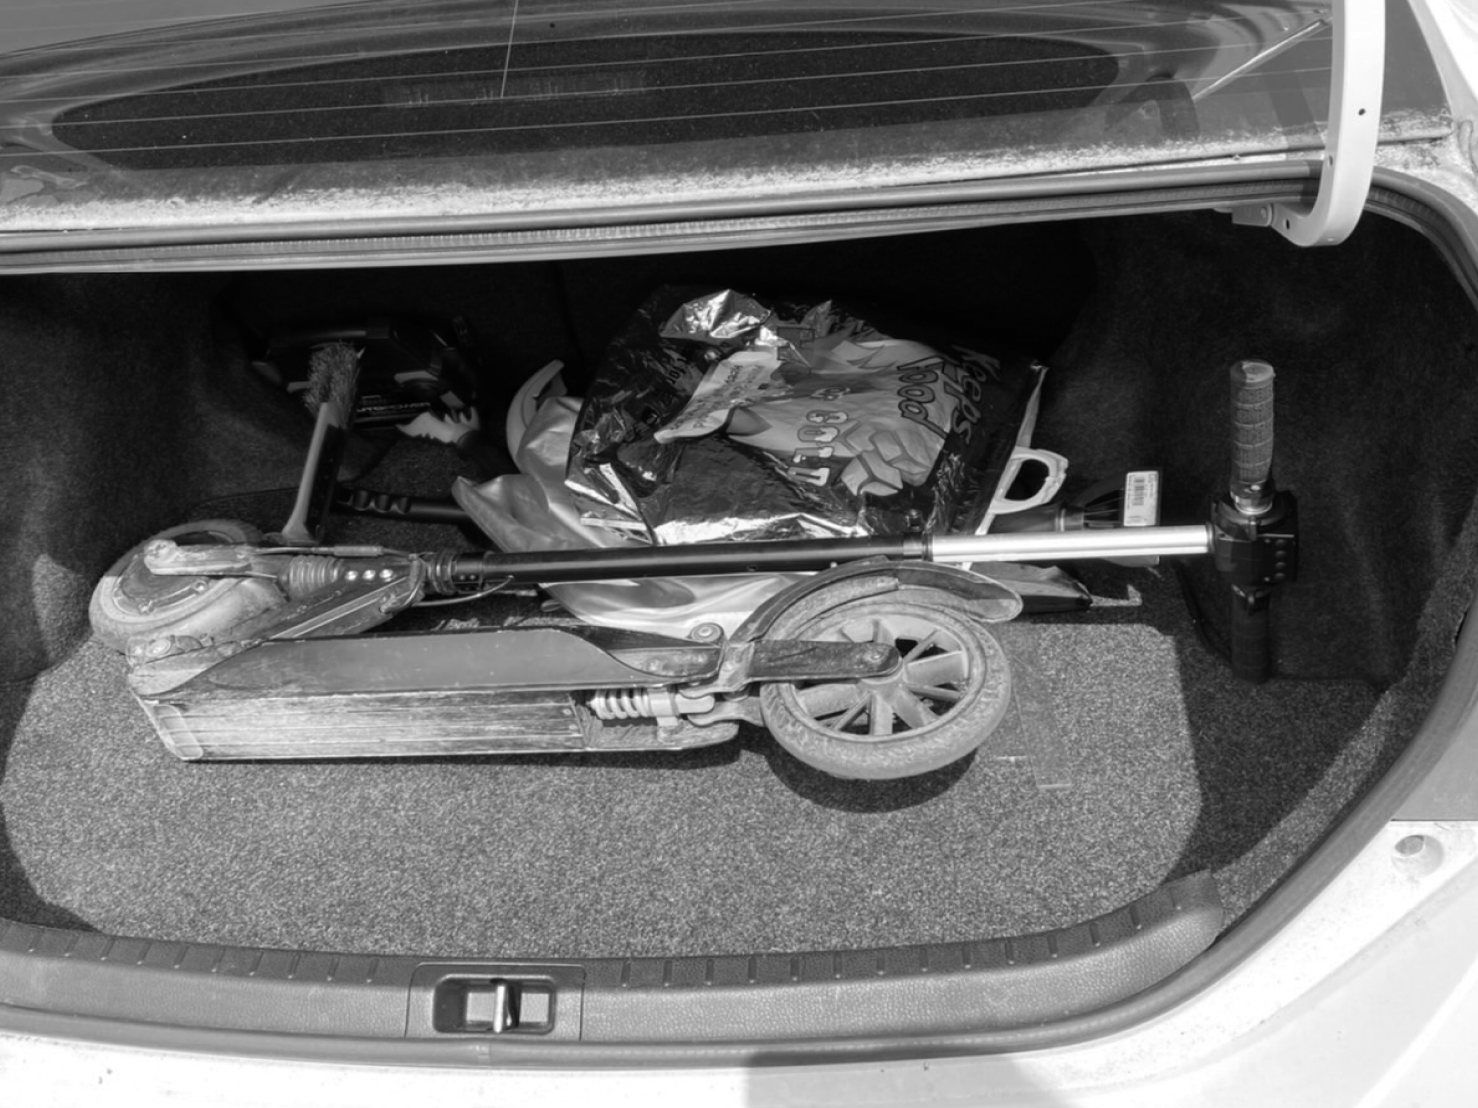
Scooter Experience

To simulate the scooter riding experience around the MLK & Reading Road intersection, a field visit was conducted with a focus on observation of :

​

  • Riding Pathway- lane and width conditions

​

  • Multimodal Simulation- how the scooter operates within the transportation system as a whole

​

  • Riding experience- the experience of riding a scooter in the innovation district with car dominated roads

Driving Route

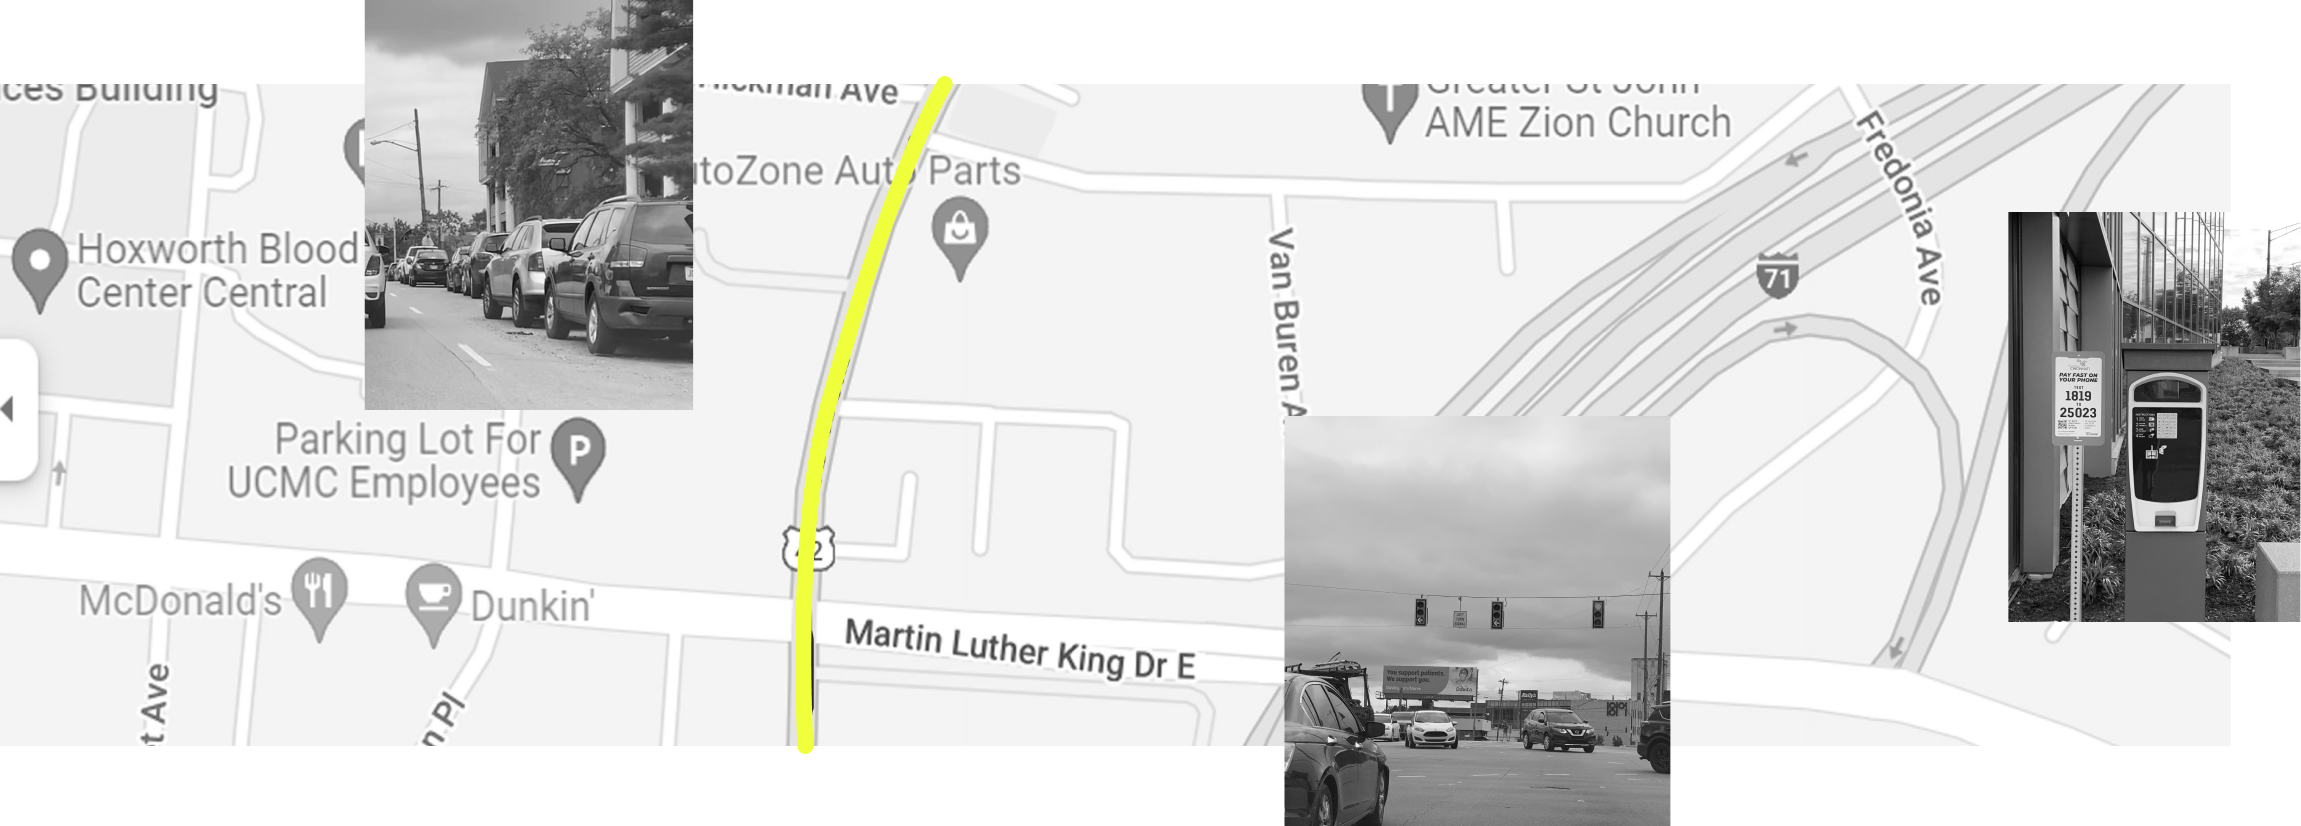
The driving experience is the most common transportation method observed. The experience of driving in the innovation district is objectively stressful due to speed of cars, amount of lanes, and difficulties parking.

Driving Experience

To simulate the driving experience around the MLK & Reading Road intersection, a route from the innovation district to the university was conducted. The following are key observations:

​

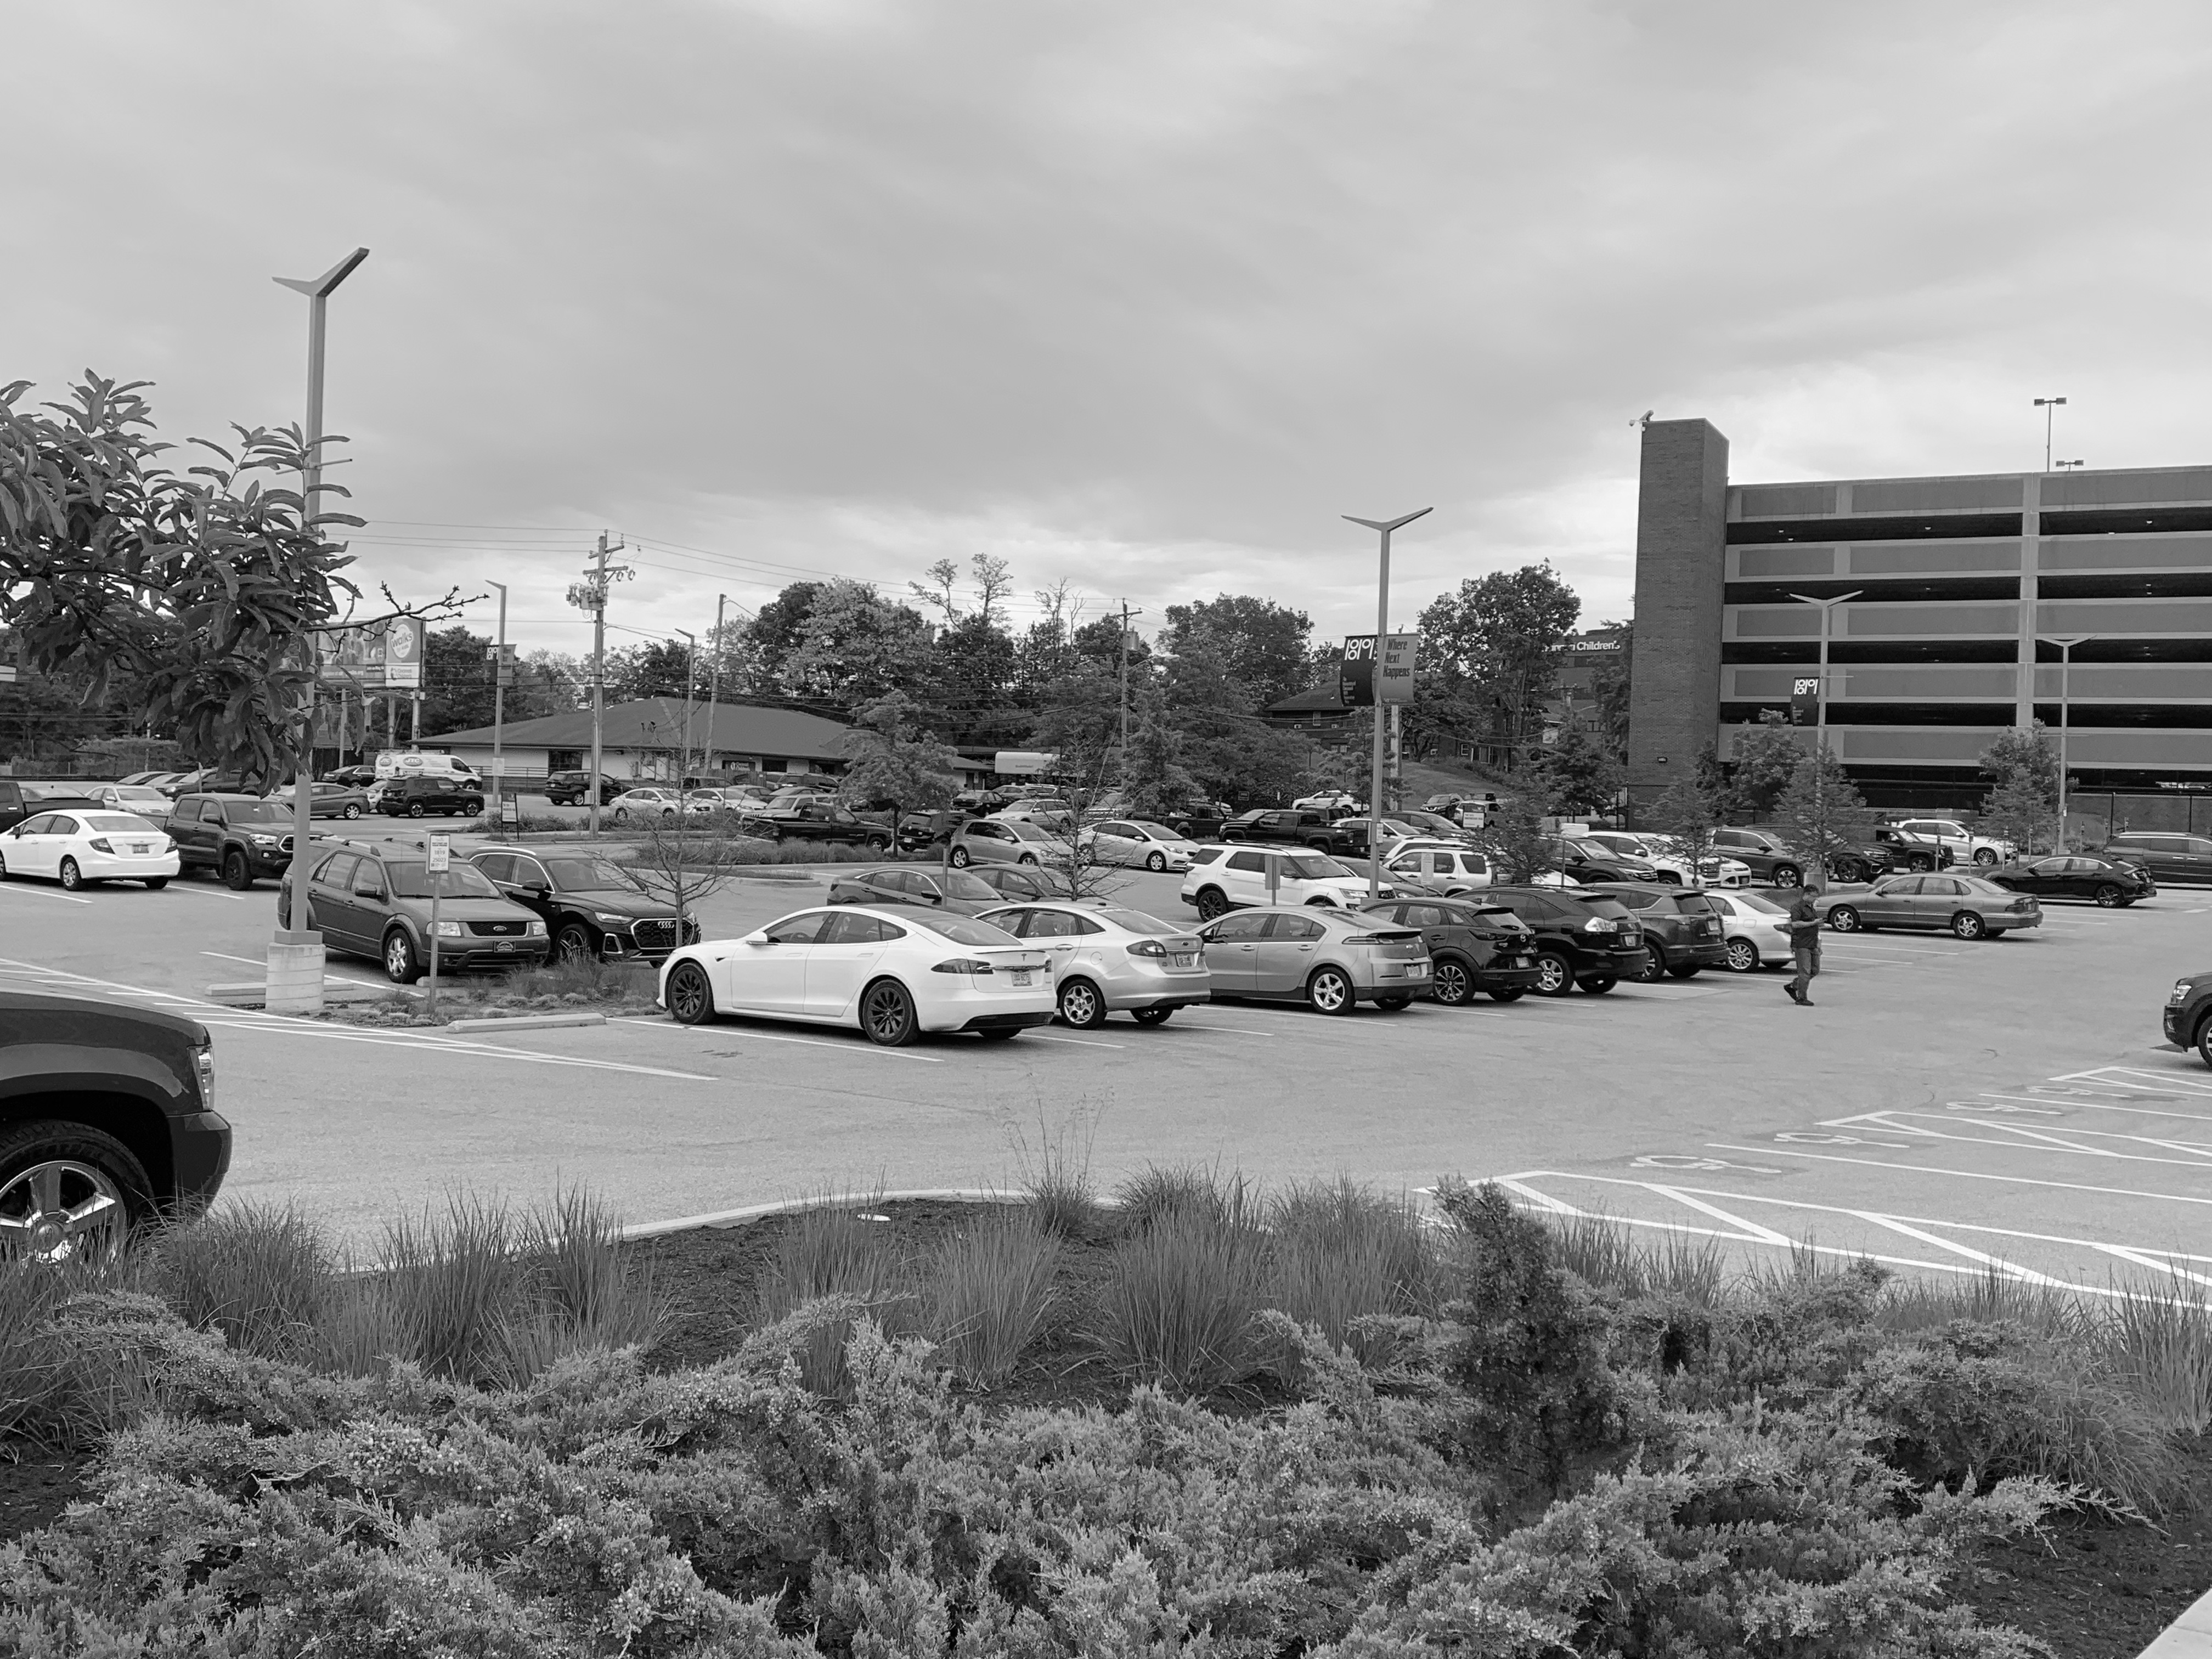
  • Parking is metered in the innovation district but surrounding areas have crowded street parking. Sometimes parked cars make it difficult to spot pedestrians.

​

  • Intersections are complex with sometimes more than 6 lanes of traffic competing, pedestrians aren’t very visible due to traffic volume.

Bus Ride Route

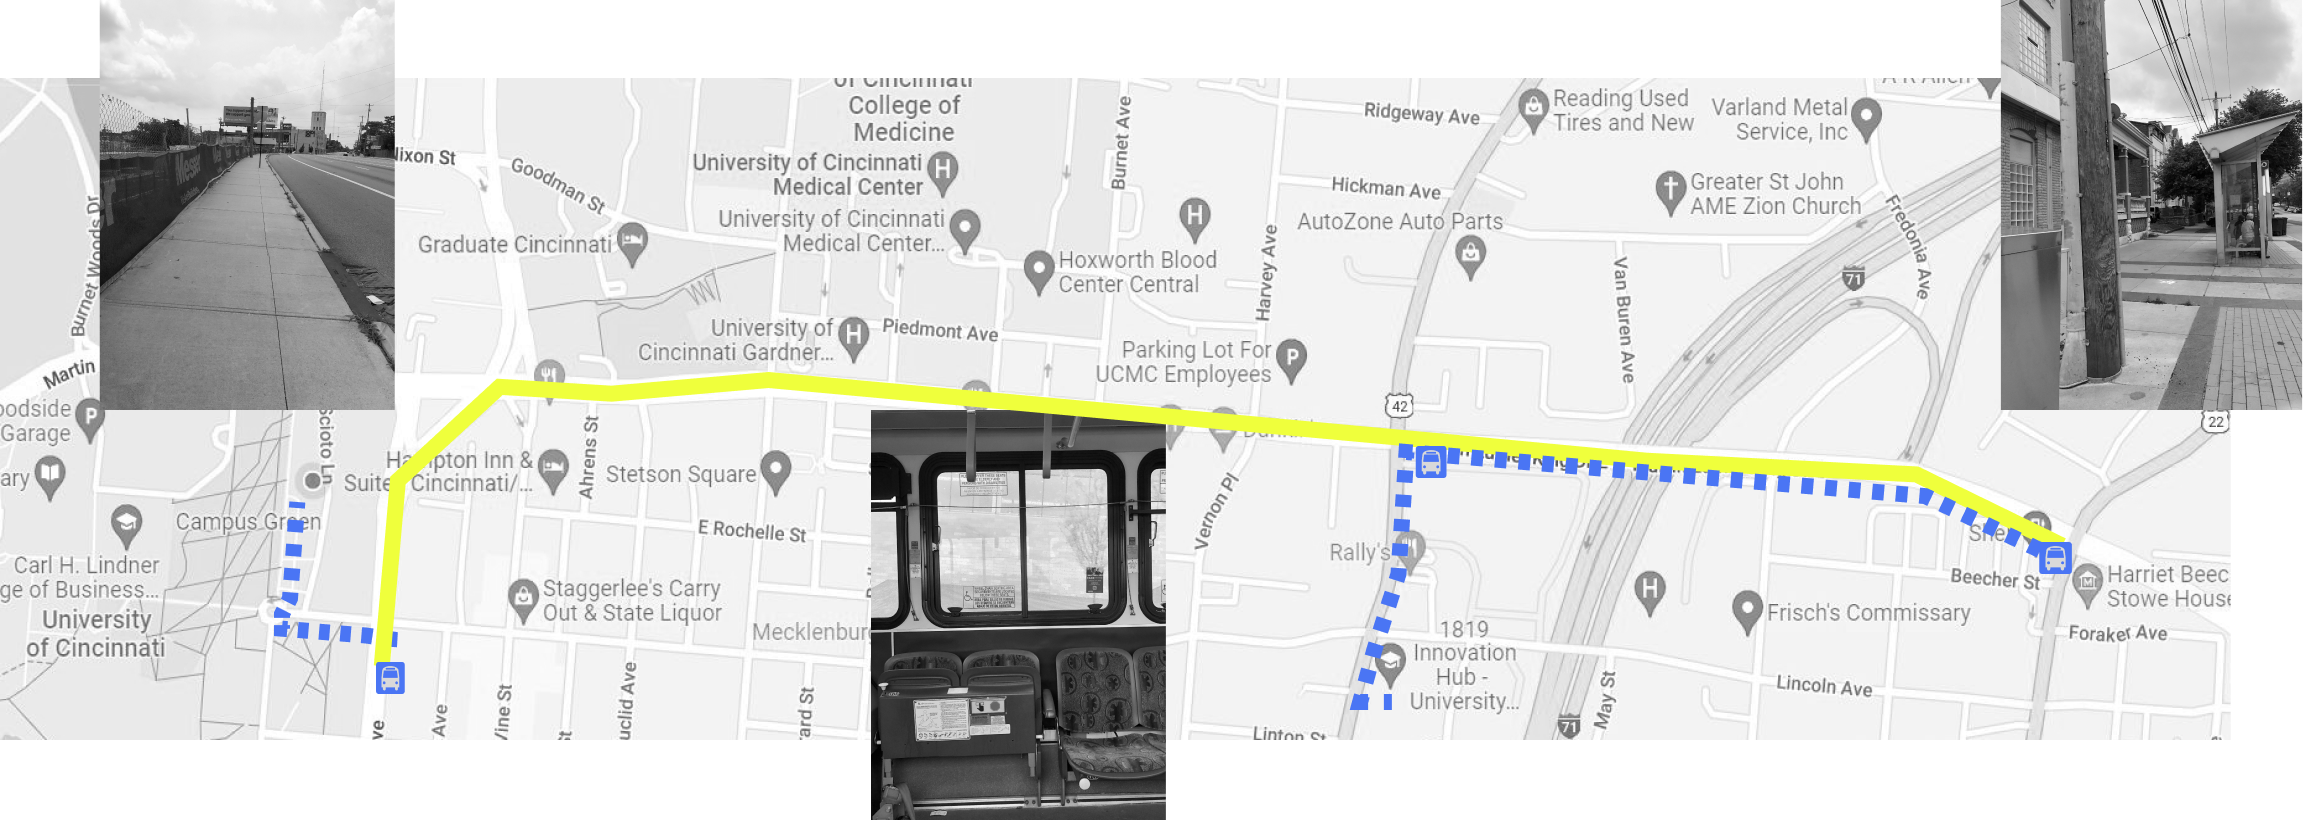
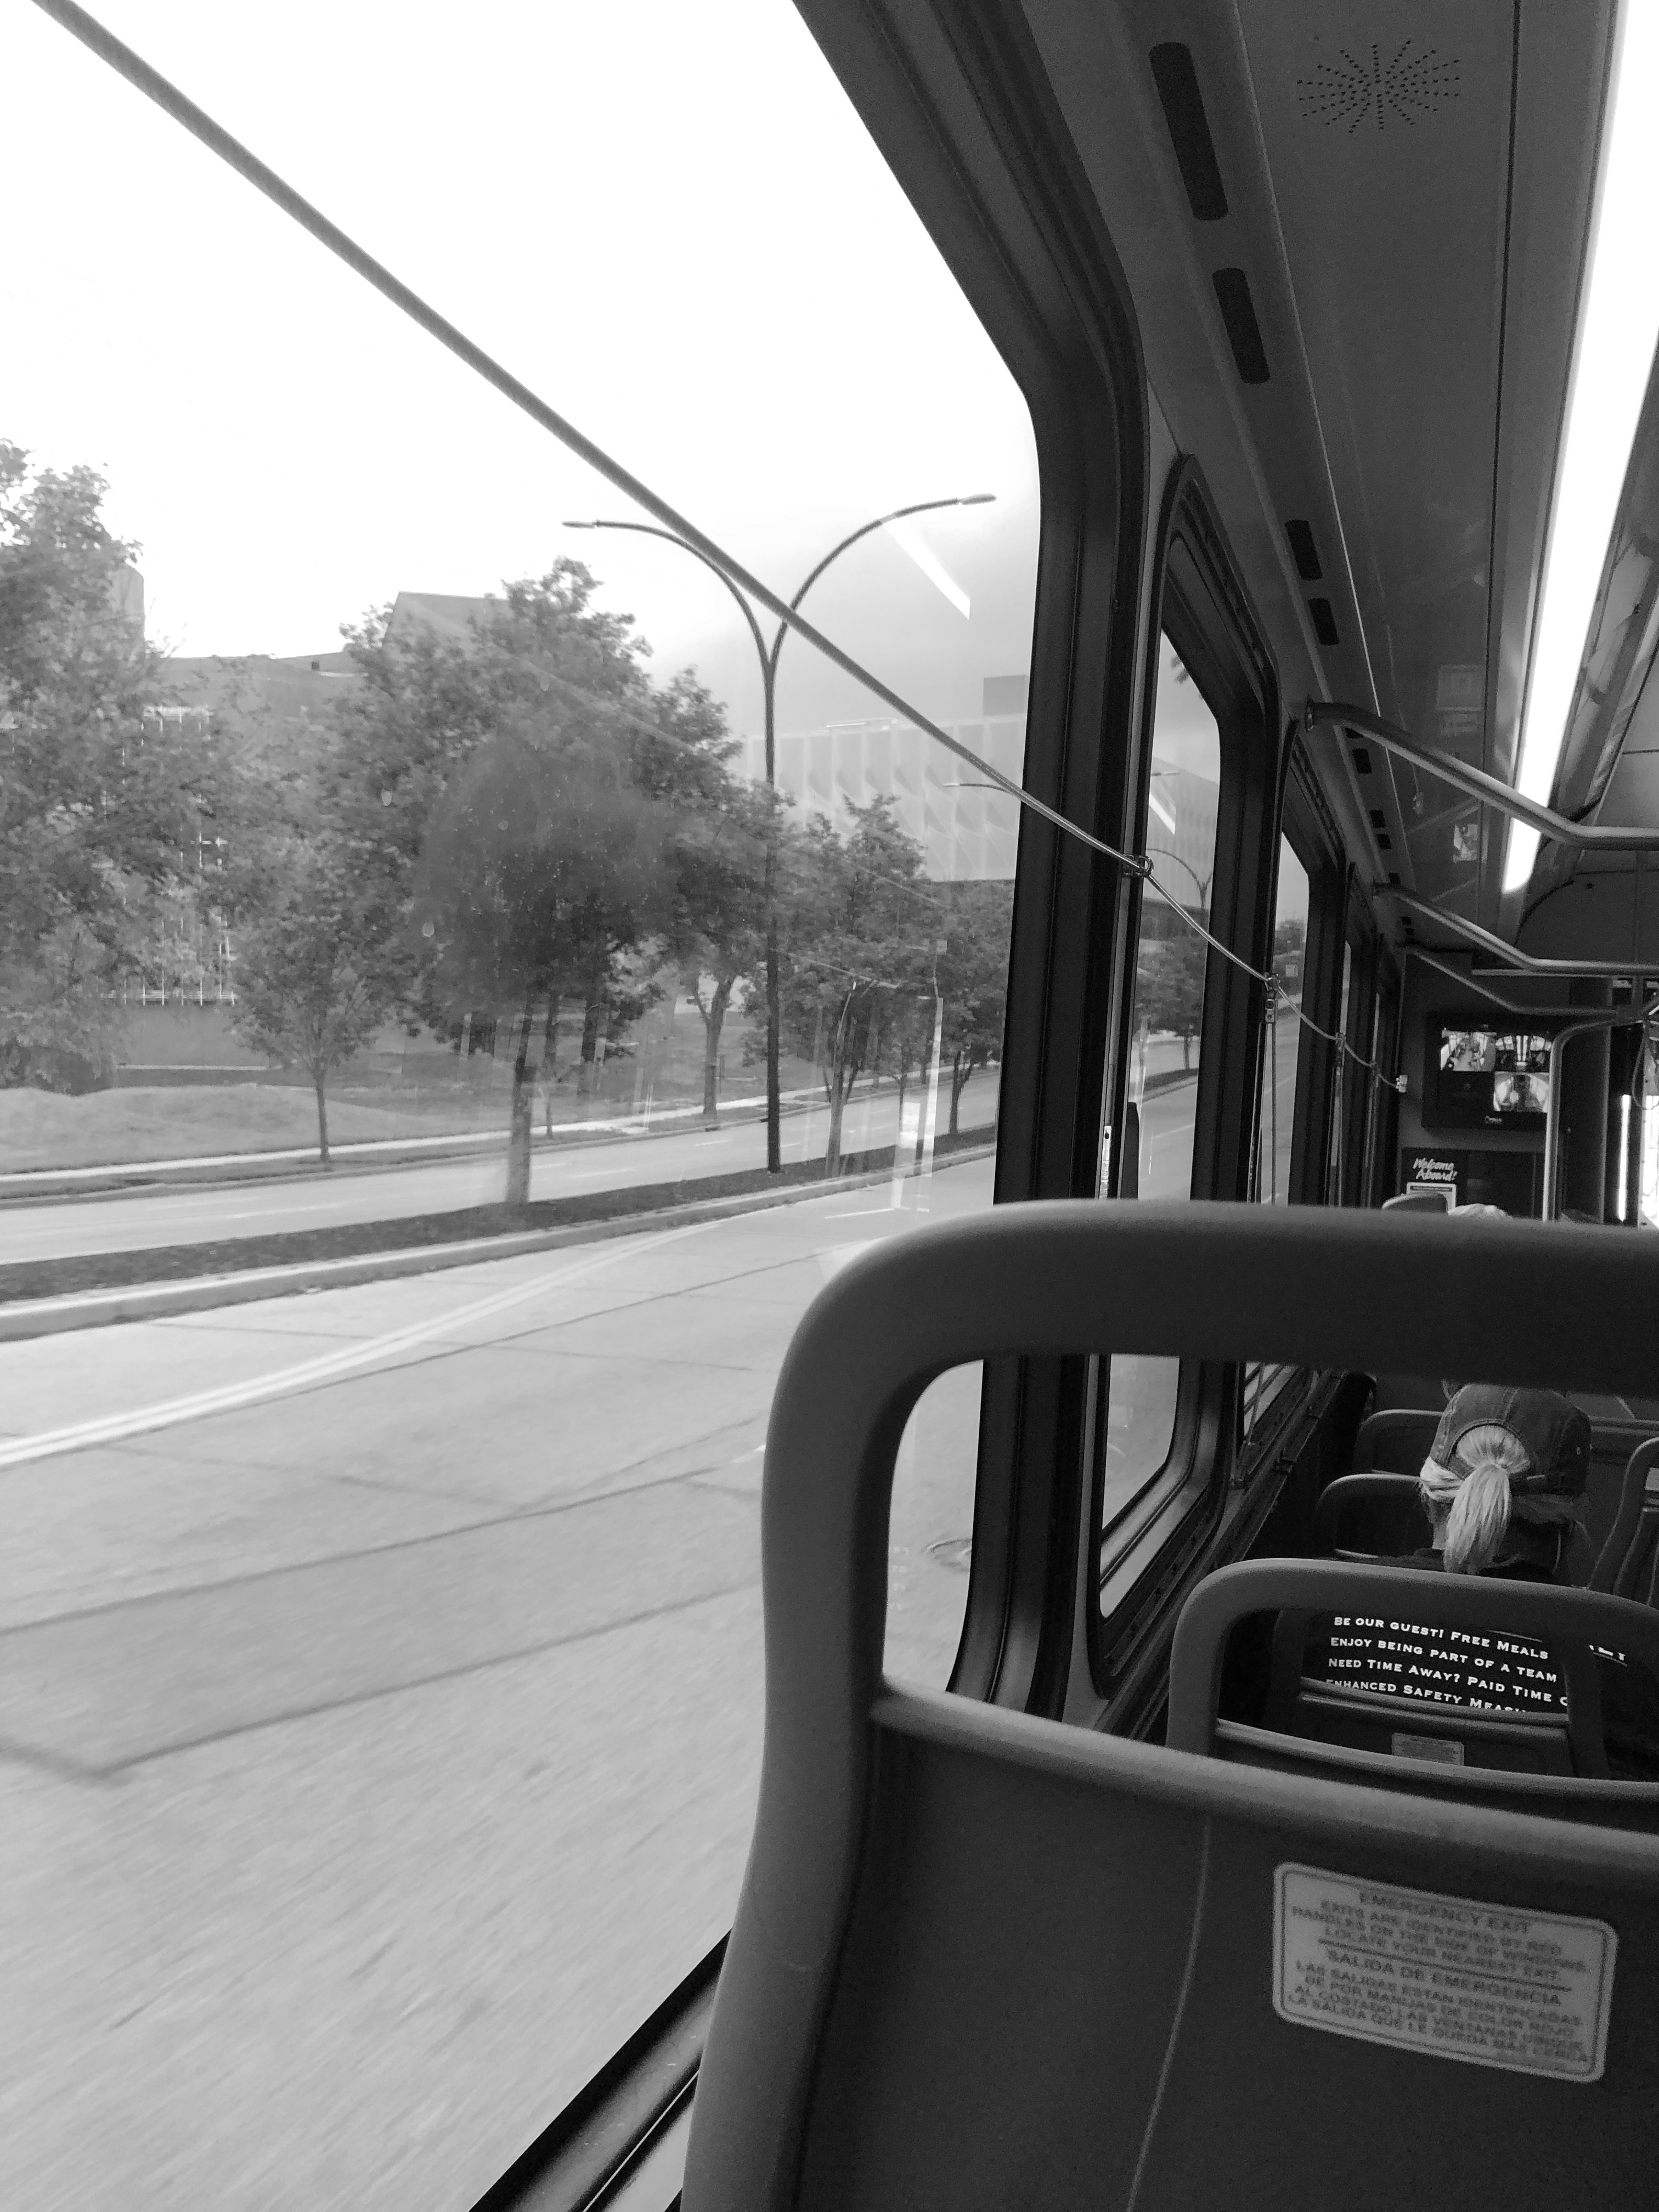
The bus riding experience is another common transportation method observed. The experience of riding the bus in the innovation district involves waiting in designated areas, following a time table, and walking a portion of your trip.

Bus Ride Experience

To simulate the bus ride experience around the innovation district, a route from the innovation district to the university was completed. The following are key observations:

​

  • Bus stop conditions varied from stop to stop.

​

  • Paying, finding the stops, and getting off were confusing as a first time rider.

​

  • Walkways connecting the bus stop to the innovation district destinations were narrow and uneven (accessibility issues).

Field Survey: Analysis of Current Transit Options

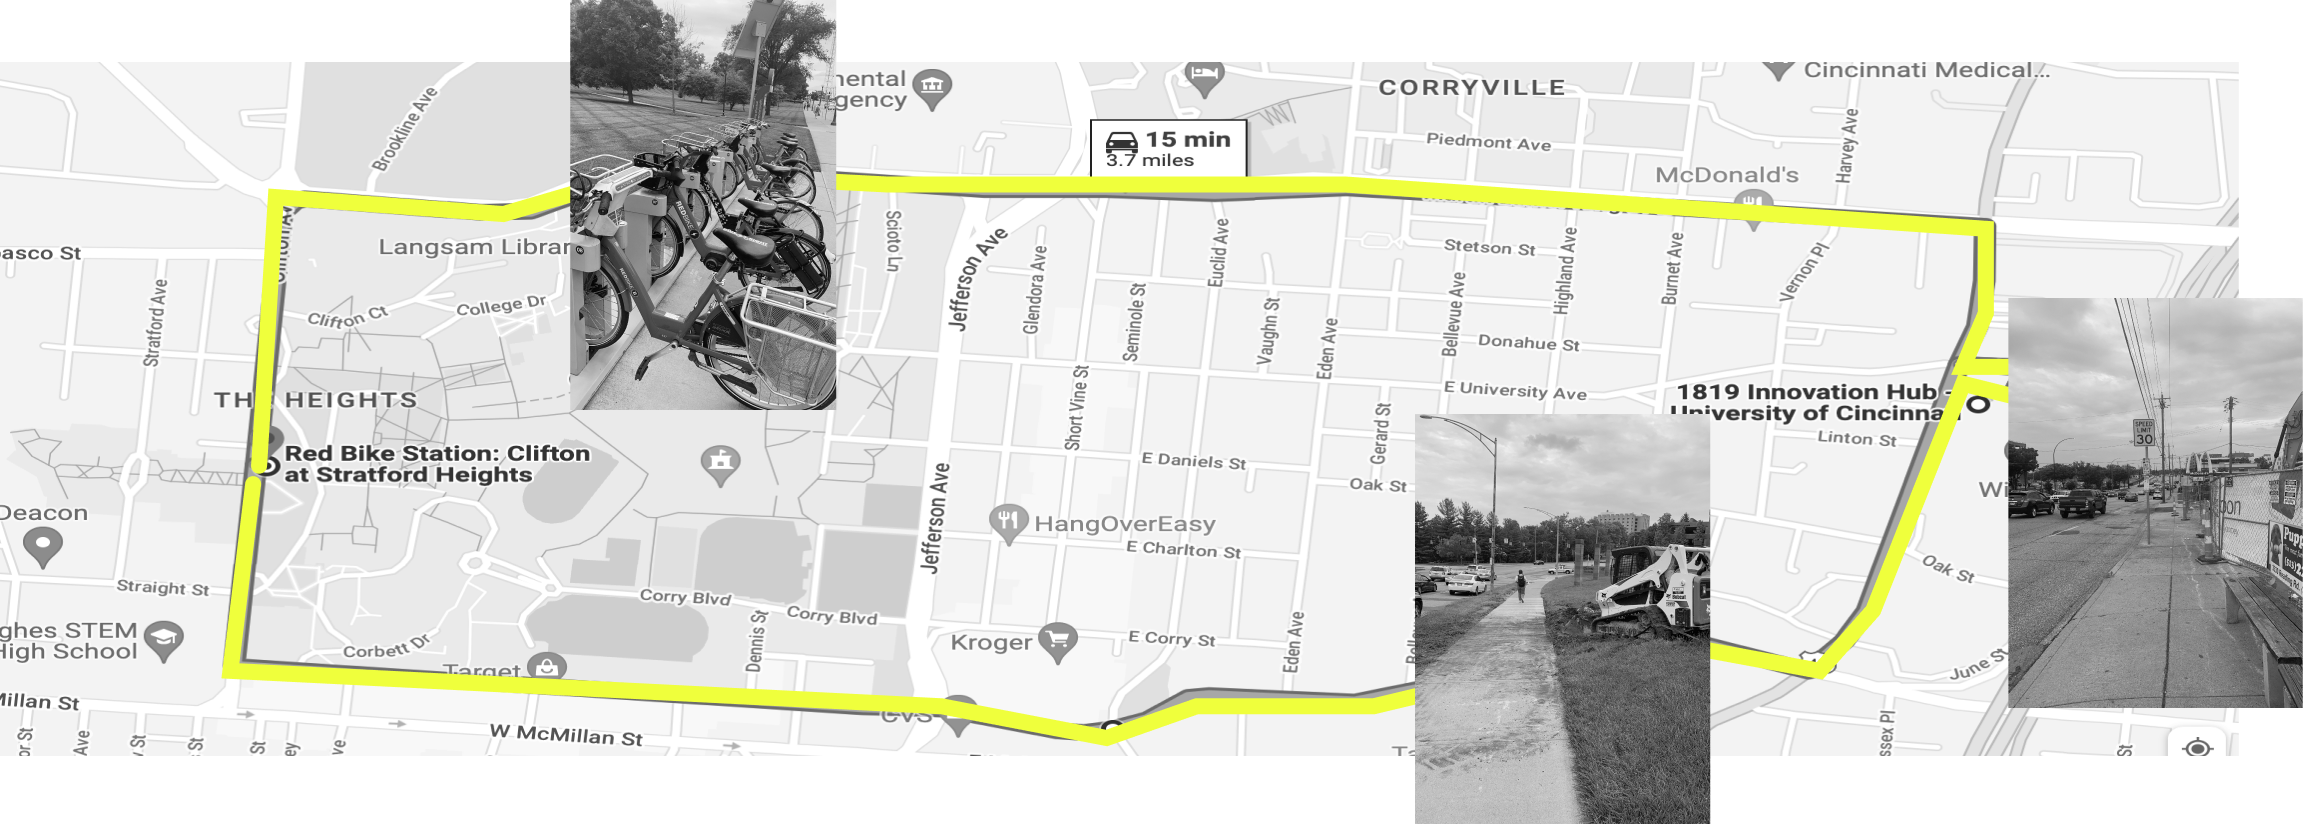
Bike Ride Route

The bike riding experience is a less common transportation method we observed. The experience of riding a bike in the innovation district involves riding in both bike lanes and in busy traffic. This transportation method is fairly quick but objectively unsafe due to cars, traffic, and visibility.

Bike Ride Experience

To simulate the bus ride experience around the innovation district, a route from the innovation district to the university was completed. The following are key observations:

​

  • Bus stop conditions varied from stop to stop.

​

  • Paying, finding the stops, and getting off were confusing as a first time rider.

​

  • Walkways connecting the bus stop to the innovation district destinations were narrow and uneven (accessibility issues).

Trend Forecasting: Predictions for 2030

  • Hyper-connectivity: Technology will blur the lines of mobility, work, and play spaces. The liminal spaces between digital and physical spaces will be redefined.

​

  • Infrastructure Adoption: Smart infrastructure will be highly connected and well integrated pushing for a high adoption rate from participants.

​

  • Smart Cities: Citizens become the focus in smart cities through the hyperconnected of automated systems and data sharing.

Technological

  • Personalized Solutions: With the implementation of AI and on demand services, personalized services and solutions will not only be possible but the new standard.

​

  • Moving to Access Points: By 2030, multimodal cities will flourish and transportation participants will need to navigate to access points to enter the transit system instead of using door to door services.

​

  • Evolving Demographics: Within the next decade, the population demographics of the United States will continue to evolve. The aging population will increase and Millennials will be the dominant generation employed.

Social

  • Super-blocks: Technology will blur the lines of mobility, work, and play spaces. The liminal spaces between digital and physical spaces will be redefined.

​

  • Spread of Disease: Elderly citizens, those with health conditions, and immunocompromised people will have more options than prior for avoiding exposure risks.

​

  • Transit Oriented Development: An increased adaption of micro-mobility solutions will lead to changes to the overall transit system in place.

Environmental

  • Shared Economy: Rather than privately owned and operated business, companies will capitalize on gig economy employment and participants will focus on access rather than ownership of products.

​

  • Modular Transportation Options: Transportation will become modular with customization fit to the users needs.

Economic

  • Private vs Public Mobility: A majority of transportation solutions will be public systems that are government operated and maintained. Participants will pay into the system rather than purchasing their own private mobility solutions. Large adoption of these systems will improve the transportation infrastructures timing, pricing, and quality. Public mobility spaces will have more importance as meeting and work spaces.

Political

Understanding Users: Life in the Innovation District

Meet Devansh

Content Creator

Minimalistic Lifestyle

Avid Traveler

Personality: Outgoing Explorer

Occupation: Fresh Graduate / Student Entrepreneur

Age: 24 Years Old

Values:

  • Self expression
  • Independence
  • Innovation

Looking For:

  • Professional network connections
  • Collaboration opportunities
  • A freelance lifestyle

Challenges:

  • Keeping content original
  • Post graduation stress
  • Imposter syndrome

Meet Teresa

Personality: Well Informed

Occupation: Traveling Nurse

Age: 32 Years Old

Values:

  • Sustainability
  • Community
  • Health

Looking For:

  • Ways to get involved in community
  • Stability while traveling
  • Friends

Challenges:

  • Loneliness and insecurity
  • Adapting to new cities
  • Sense of belonging

Vegetarian

Coffee Shop Hopper

Thrift Shopper

Artistic Tourist

Yoga Ensusiast

Long-distance Relationship

Meet Erica

Personality: Dependable

Occupation: Nonprofit Founder and Caretaker

Age: 49 Years Old

Values:

  • Trying things
  • Wellness
  • Family

Looking For:

  • Convenient transportation options
  • Fun outdoor activities
  • Local networking

Challenges:

  • Sandwiched caregiver
  • Work/Life balance
  • Creative burnout

Devansh

Student Entrepreneur

47,000+

Enrolled UC Students

Teresa

Travel Nurse

5,000+

Visiting Researchers/Staff

Hospital Interns/Scholars

52,000+

Innovation District Employees

Erica

Nonprofit Founder and Caretaker

Represented Demographics: Academia + Research + Community

Getting Community Feedback: Interviews and Surveys

Community Survey Feedback:

We sent a survey to community members that have interacted in the innovation district and received 35 responses. The survey was sent to a variety of participants and covered the following topics:

​

  • Factors they look for in a livable city
  • What their current experience of living and traveling in the innovation district is
  • Their thoughts and unique experiences interacting with the current transportation systems
  • Their suggestions for improving the quality of life in the innovation

Safety

23 (95.8%)

Climate

7 (29.2%)

Community and Network

7 (29.2%)

Research and Development

5 (20.8%)

Infrastructure and Public Entity

11 (45.8%)

Living Cost

21 (87.5%)

Transportation and Mobility

17 (70.8%)

Economy and Employment

19 (79.2%)

Culture and Equity

17 (70.8%)

Access to Shops and Services

11 (45.8%)

Access to Entertainment

12 (50%)

Access to Education

13 (54.2%)

Access to Health Care

15 (62.5%)

Access to Nature

13 (54.2%)

What are the main factors you look for in a livable city?

  • out of 24 responses

Means of Transportation

Transportation Experience

Walk

20

5

20

4

3

Car(Self-owned)

Shuttle/Bus

Bike

Scooter

Sources: Experience Survey Responses (n=34)

Walking and self-driving are the most common transportation methods for navigating Cincinnati.

Sources: Experience Survey Responses (n=34)

​

The average score of transportation experience in Cincinnati is 5.

The Better Choice

  • ”Walking is too far up hill and I don't feel safe on a bike/scooter. Car is my best option”
  • “I drive because it is unsafe to ride my bike and the walk takes too long to be practical.”

​

Caretaking Obligation

  • ”When work from home, obviously I "walk" and I use a bike or the streetcar to get around downtown. When I was at 1819, I drove most days (and generally do have to drive the days I take the kids to school)”

​

Distance Consideration

  • “I drive because I have to drop off kids, wife, and check out different sites that are geographically separated.”

Limited Public Transportation

  • ”Bad public transportation forces people to drive.”
  • ”The buses here are slow and limited. Even though it is cheap but sometimes I don’t feel safe at night. UC Shuttle is ok but there can be a really long waiting time if you missed it.”

​

Car-Centric City

  • ”Cincinnati has a car problem, my quality of life would go up significantly if I didn't have to worry about getting hit by cars every-time I went out walking around. I prefer the idea of streets as rooms to street as paths. The street amenities that make car drivers comfortable are different from the street amenities that make walking people comfortable.”
  • ”Car centric city design sucks. Should be friendlier to pedestrians and cyclists.”

Poor

Excellent

1

2

2

1

3

6

4

6

5

2

6

7

7

2

9

2

10

2

8

4

Connecting the Personas: Community Interactions

Safety, Access, Community Building

Devansh

Student Entrepreneur

Teresa

Travel Nurse

Erica

Nonprofit Founder and Caretaker

On-demand

Mobility

Exploration

Caretaking

Creation

Mindfulness

Zone

Networking

Research Wrap Up: Our Proposal

The System’s Focus:

Connectivity

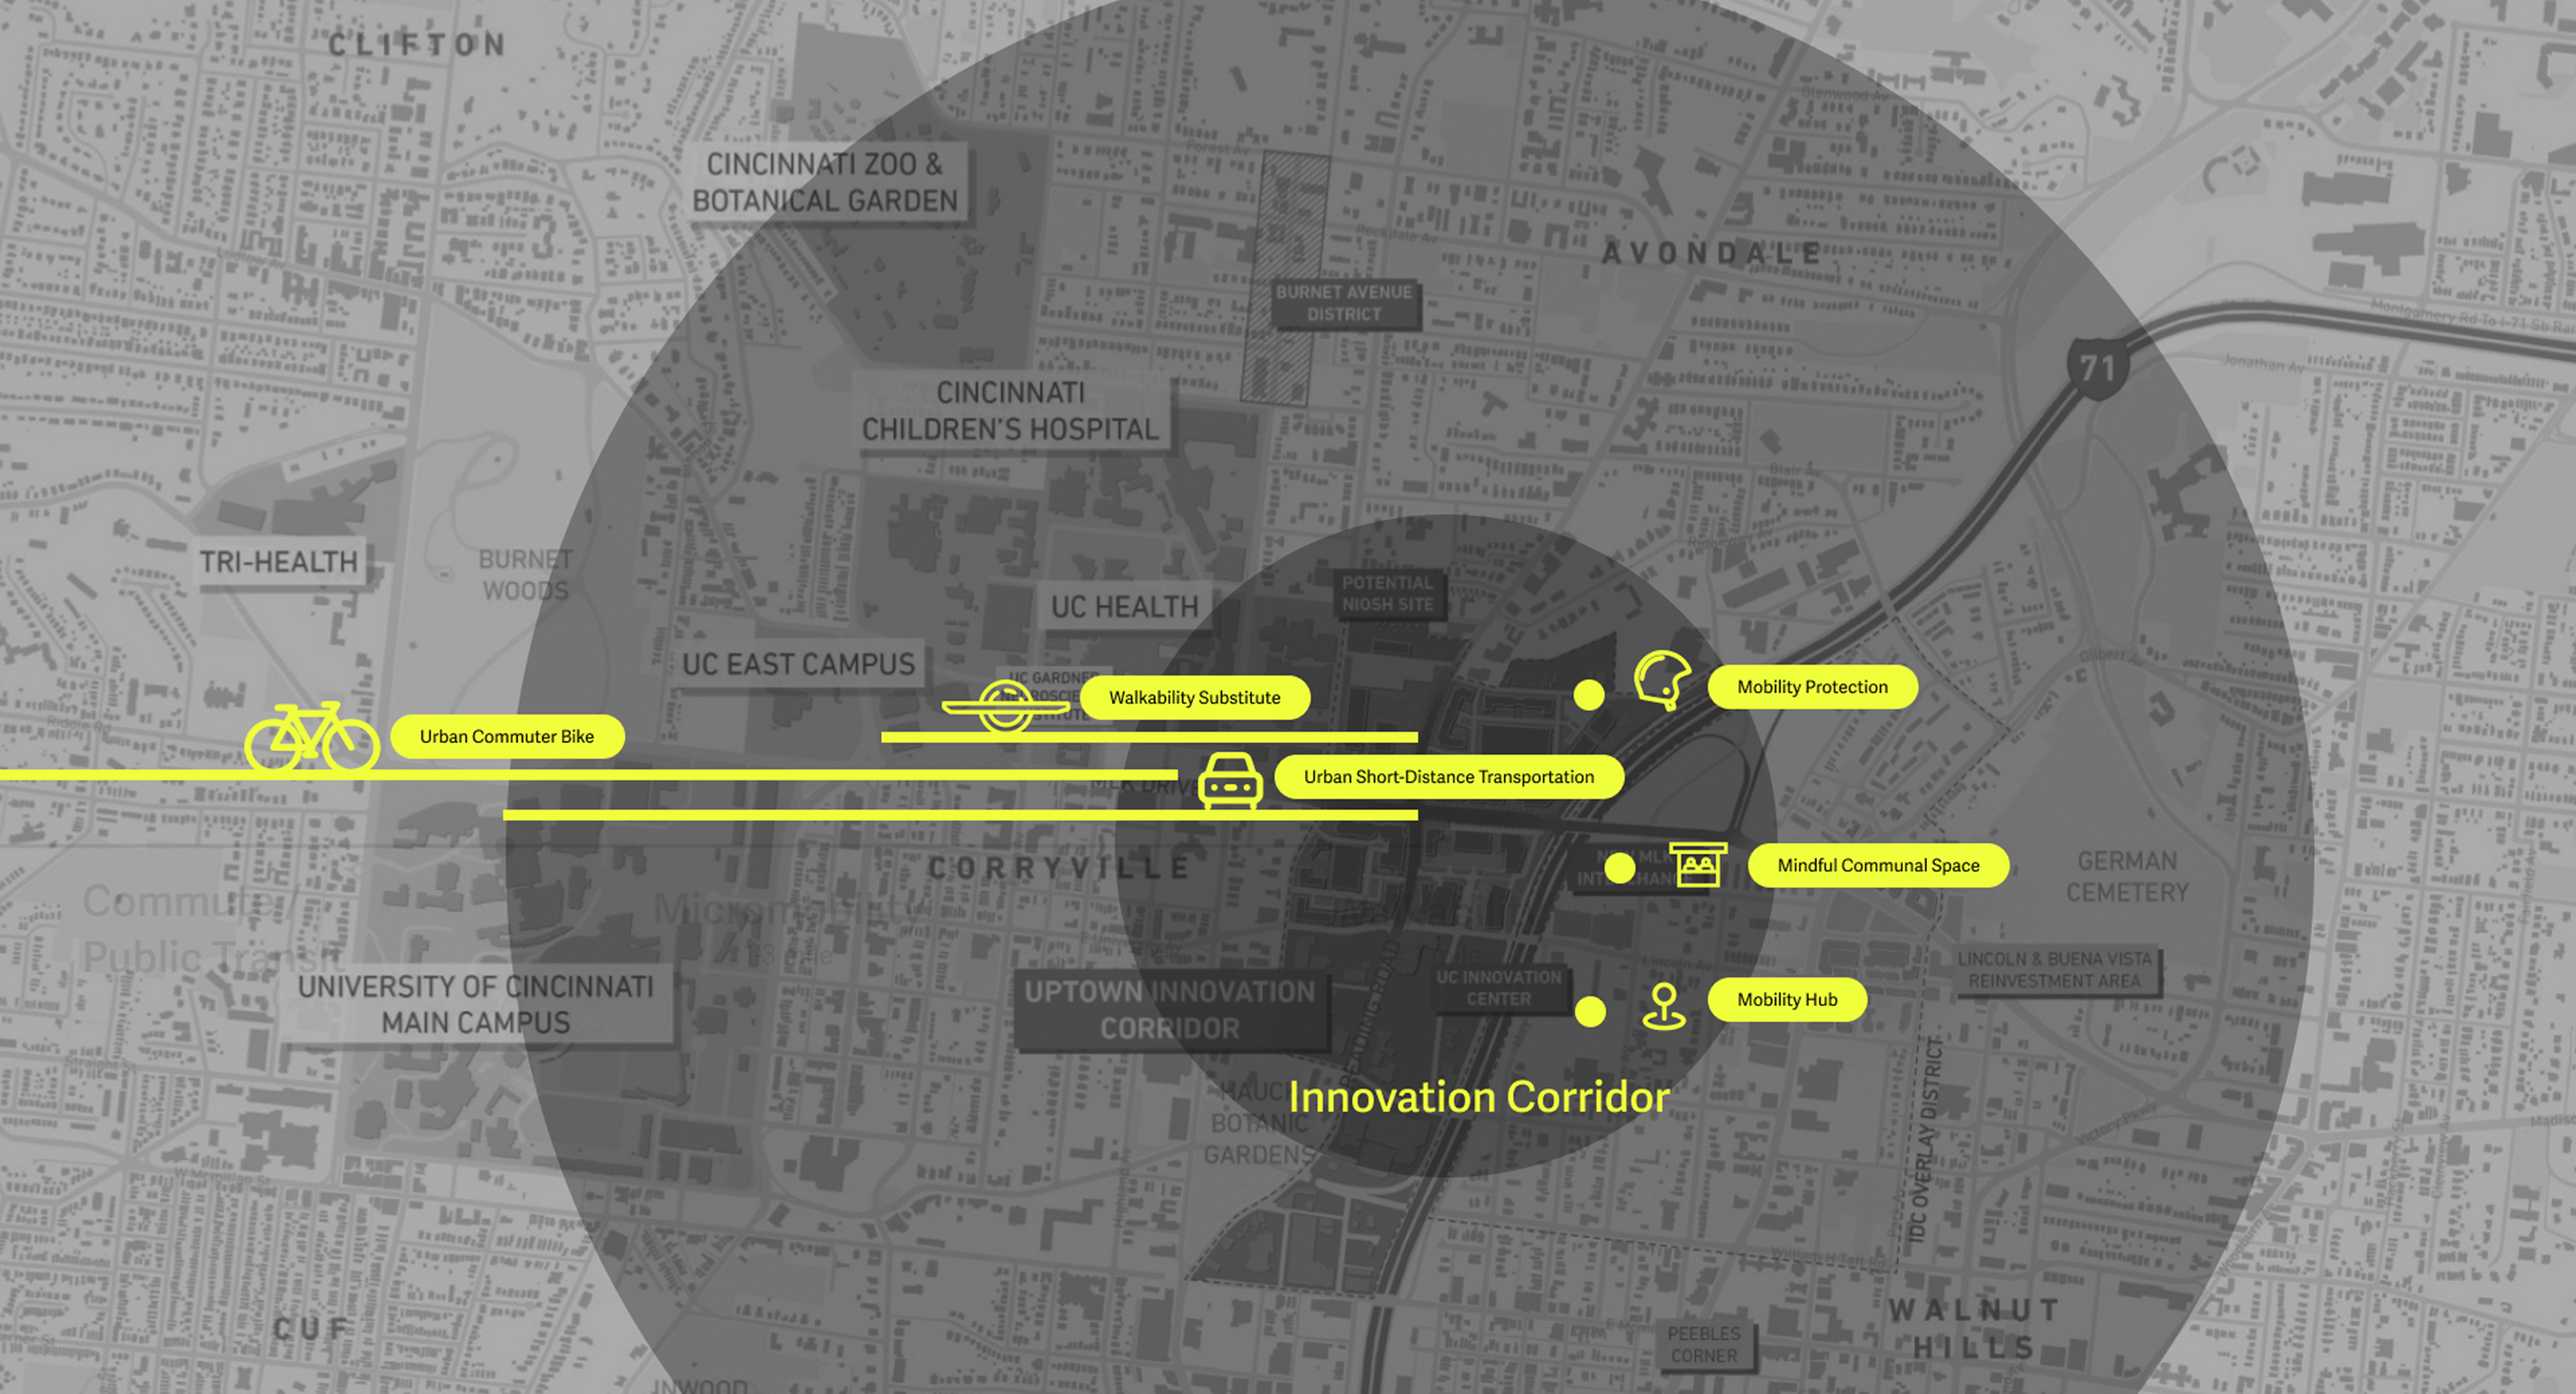
An connected system that enables seamless transition between living and navigation experiences

  • On-demand shared mobility network
  • Seamless connections across all devices

Wellness

The fulfillment of physical safety and mental wellbeing across all forms of living

  • Perceived safety of mobility experience
  • Mindful sapce for community building

Sustainability

A long-lasting harmonious balance with the integrated environment

  • Lowering carbon footprint
  • Energy-saving green technology

The Proposed Transportation System:

Tech-Savy

Thank You!

Part-time fitness trainer

Work Hard, Play Hard

Hiker/Nature Lover

Family-focused Caretaker

Cincinnati Native

Non-profit Owner

Active

Sports Fan

Writer